What is a financial model?
A financial model is a spreadsheet that represents how a company makes and spends money, and projects its financial statements into the future from a set of assumptions. It is used to value a company, plan a budget, raise debt or equity, and test decisions before making them.
What's inside a financial model
Whatever its purpose, a company financial model has the same building blocks:
- Historical financial statements — the income statement, balance sheet and cash flow statement for the last few years, taken from the annual report.
- Assumptions (drivers) — what moves each line in the future: revenue growth or price × volume, margins as a percentage of revenue, capital expenditure, days of receivables, interest rates, tax rate, dividends.
- Projections — the statements extended five to ten years, every projected number a formula over the drivers.
- Supporting schedules — the detail behind lines that need their own logic: fixed assets (PP&E: opening balance + capex − depreciation), debt (drawdowns, repayments, interest), leases, working capital.
- Outputs — a summary, ratios (margins, returns, leverage, coverage) and, when the purpose is valuation, a discounted cash flow.
The 3-statement model
The heart of almost every corporate model is the 3-statement model: the income statement, balance sheet and cash flow statement, linked so that a change anywhere flows through all three.
Net income adds to retained earnings on the balance sheet; depreciation comes from the PP&E schedule; interest comes from the debt schedule; and the cash flow statement explains, line by line, why cash moved from one balance sheet to the next. If the links are right, the balance sheet balances in every projected year without any plug — the first test of a sound model.
From the model to a DCF valuation
A DCF (discounted cash flow) valuation is built on top of the projections:
- Unlevered free cash flow for each projected year: EBIT − taxes on EBIT + depreciation & amortization − capex − increase in working capital.
- Discount rate (WACC): the cost of equity (risk-free rate + beta × equity risk premium) and the after-tax cost of debt, weighted by the target capital structure.
- Terminal value for the years after the projection: a perpetual growth rate on the last cash flow, or an exit multiple of EBITDA.
- Equity value: enterprise value − debt − lease liabilities − minority interests + cash, divided by the number of shares.
Because the valuation is sensitive to the discount rate and the terminal assumptions, models show tables of value across a range of WACC and growth rates.
Types of financial models
- 3-statement model — the linked statements with projections; the base for the others.
- DCF model — a 3-statement model plus a discounted cash flow valuation.
- LBO model — a leveraged buyout: how much debt an acquisition can carry and the return to the equity investor.
- Merger model (M&A) — the combined company after an acquisition and its effect on earnings per share.
- Project finance model — a single asset (a plant, a toll road) financed on its own cash flows, with debt sized on coverage ratios.
- Budget and startup models — plans for the next one to five years, usually driven by operating metrics (customers, headcount, prices) rather than history.
How a financial model is built
- Collect the historical statements from the annual reports and notes, and map every account to a consistent structure.
- Choose the drivers for each line — ideally the operating activity behind it (volumes, prices, capacity) when the documents report it, otherwise growth rates and ratios.
- Build the schedules for fixed assets, debt and leases, and link them to the statements.
- Project and link the three statements, with cash as the balancing line, and check that the balance sheet balances.
- Add the outputs: summary, ratios and valuation.
- Review the assumptions and test scenarios.
Steps 1 to 5 are where most of the time goes and where most errors start — a mistyped number, an account mapped to the wrong section, a broken link that leaves the balance sheet out of balance. Skale automates them: it reads the annual report and financial statements, extracts and classifies every account, builds the linked statements, schedules, ratios and valuation in Excel with live formulas, and leaves you the assumptions to review.
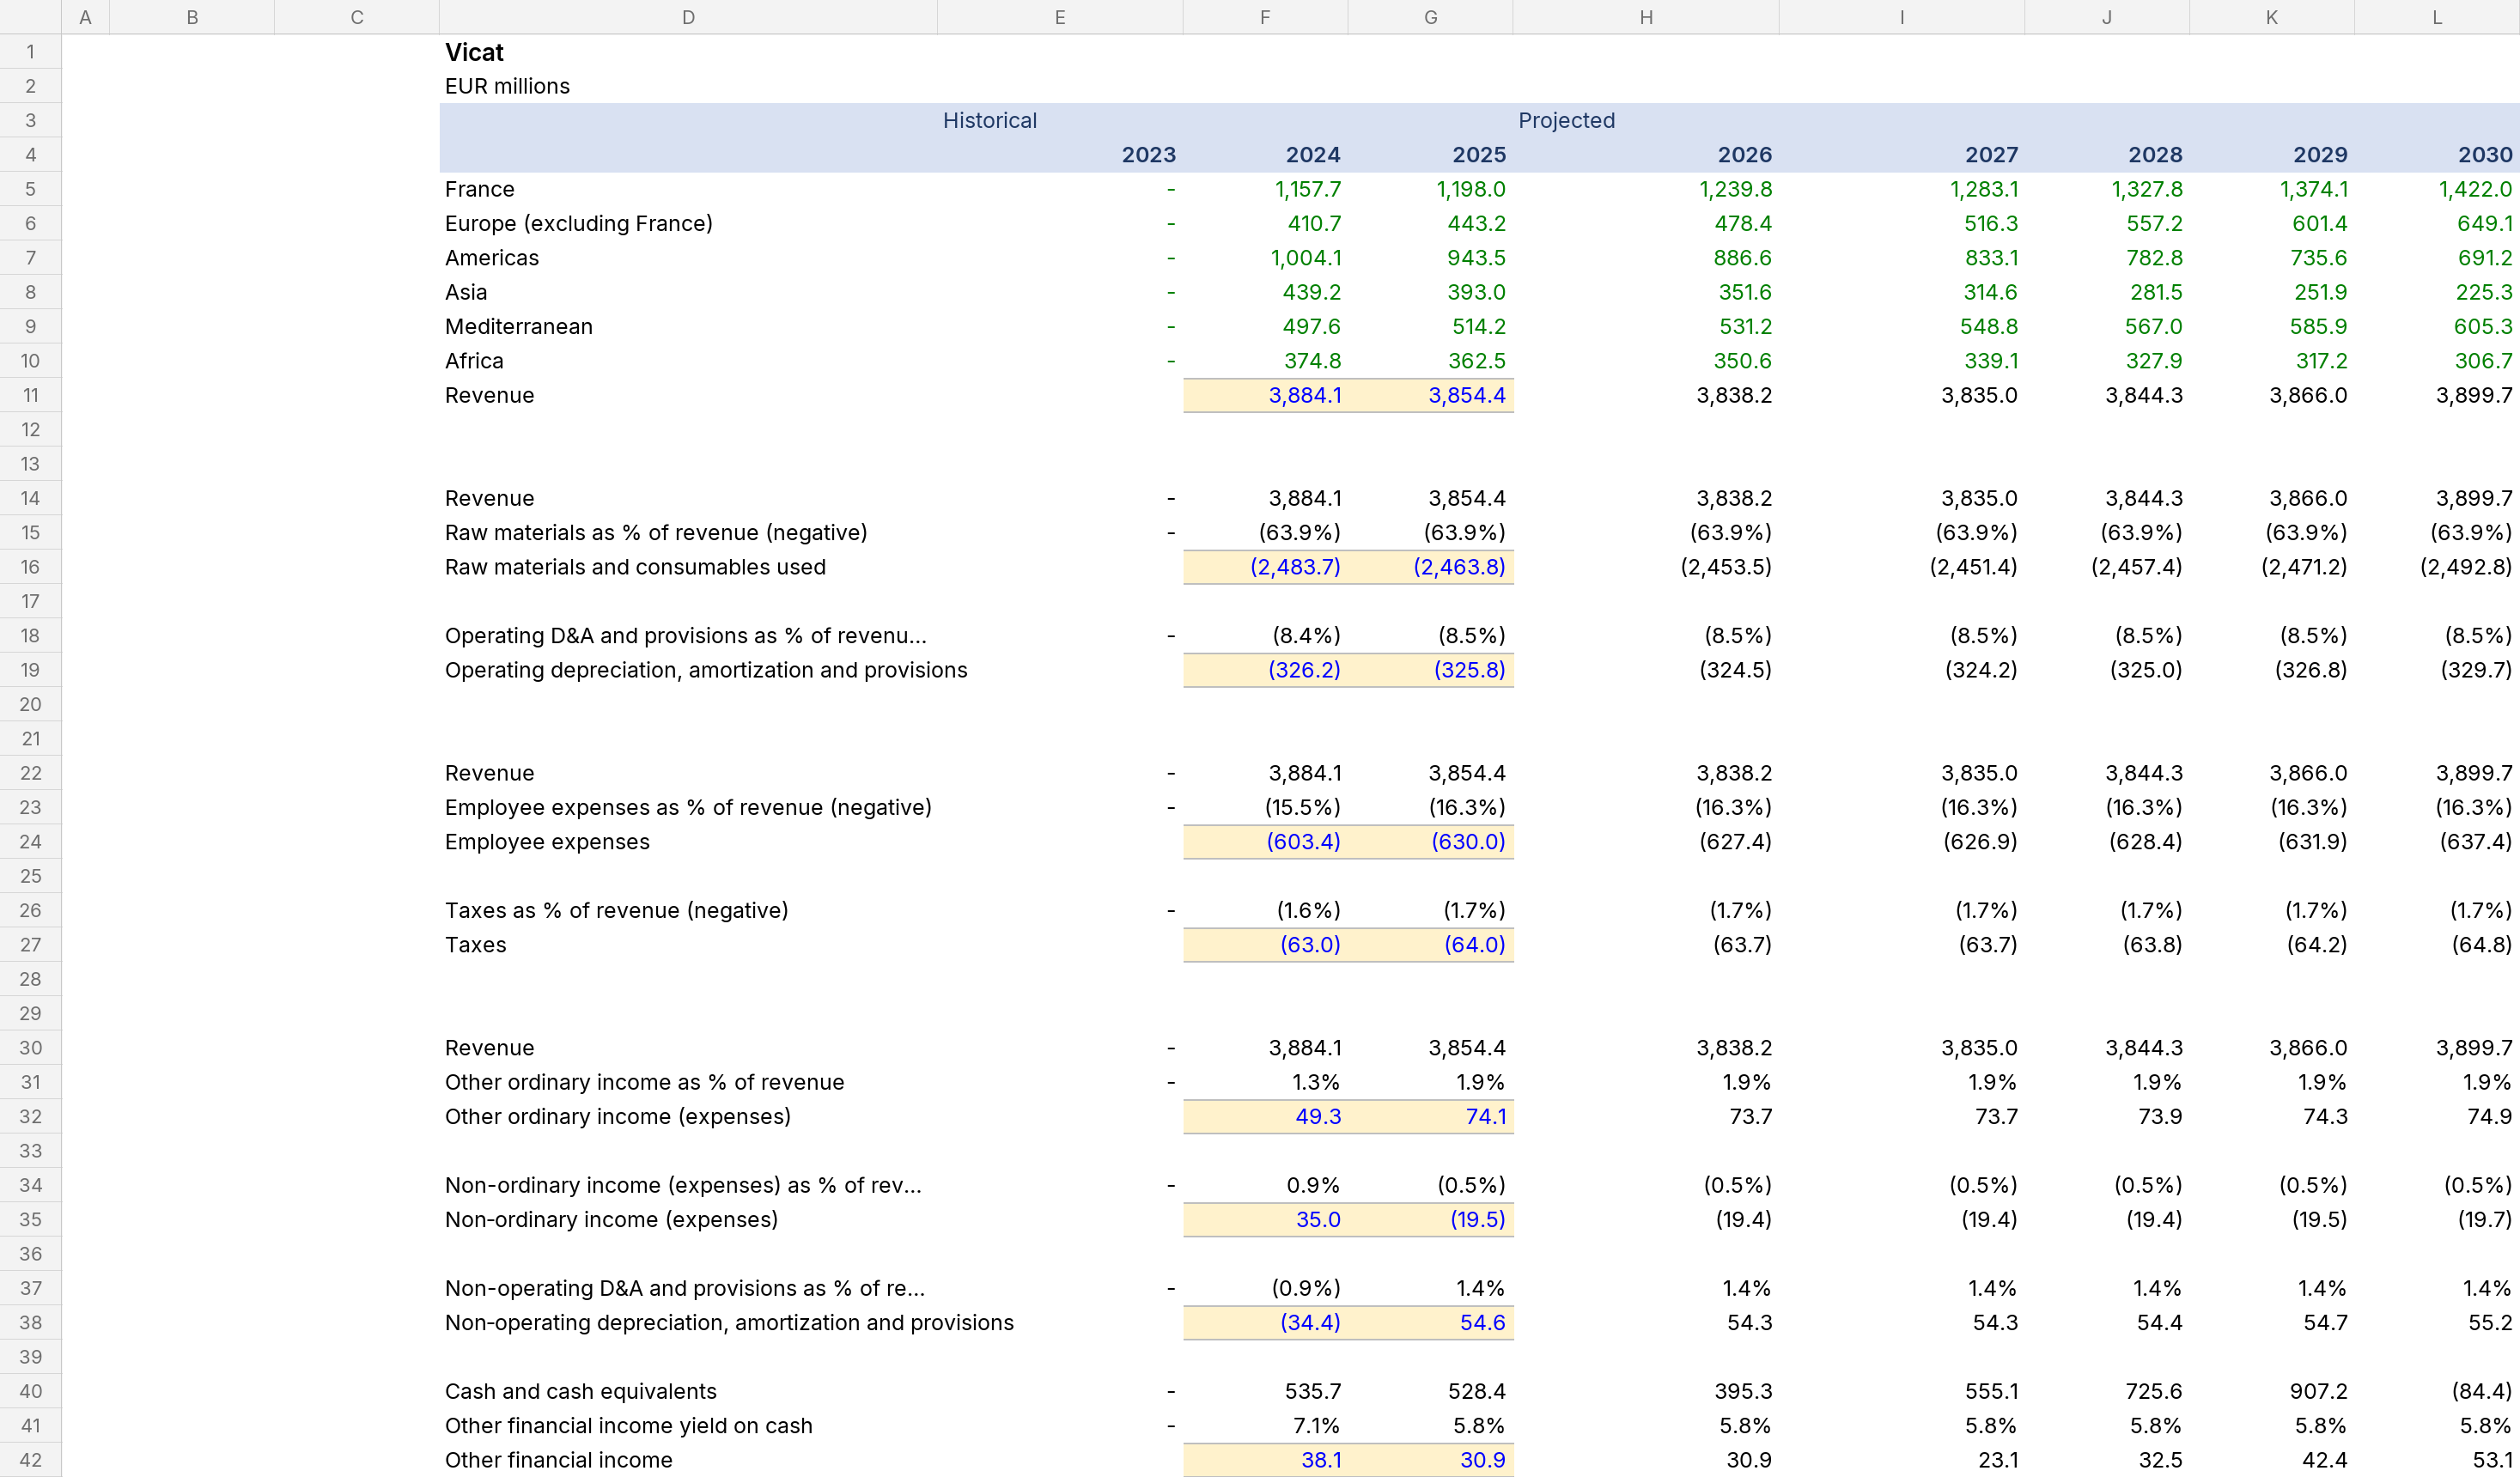
A real example: Vicat Group
Here is part of the Vicat Group model Skale built from its published documents. Every projected cell is a formula; the input files and the Excel are on the Vicat Group financial model page.
Frequently asked questions
What is a 3-statement model?
A model of the income statement, balance sheet and cash flow statement that are linked to each other: net income flows into retained earnings and the cash flow, the cash flow ends in the balance sheet's cash, and the balance sheet balances in every year. It is the core of almost every corporate financial model.
What is the difference between a financial model and a DCF?
A DCF (discounted cash flow) is one use of a financial model. The model projects the statements; the DCF takes the free cash flows from those projections, discounts them at the cost of capital (WACC) and adds a terminal value to estimate what the business is worth.
Are financial models built in Excel?
Mostly, yes. Excel is the common language of finance teams, banks and investors because every number can be traced to its formula and changed. A good model keeps inputs, calculations and outputs clearly separated.
What is the difference between a financial model template and a financial model?
A template is an empty structure you fill in by hand. A model is built for a specific company: its own revenue lines, accounts, debt and assumptions, with history from its financial statements. Templates rarely fit a real company's accounts without rework.
How long does it take to build a financial model?
By hand, a 3-statement model of a listed company typically takes an analyst from several days to a few weeks, most of it spent copying historical data, mapping accounts and fixing a balance sheet that doesn't balance. Skale automates that part, so the time goes into reviewing the assumptions.