Vicat Group financial model
The Vicat Group is a French family-controlled construction materials company specializing in cement, ready-mixed concrete, and aggregates.
Preview the Excel
The first rows of each sheet, as they open in Excel.
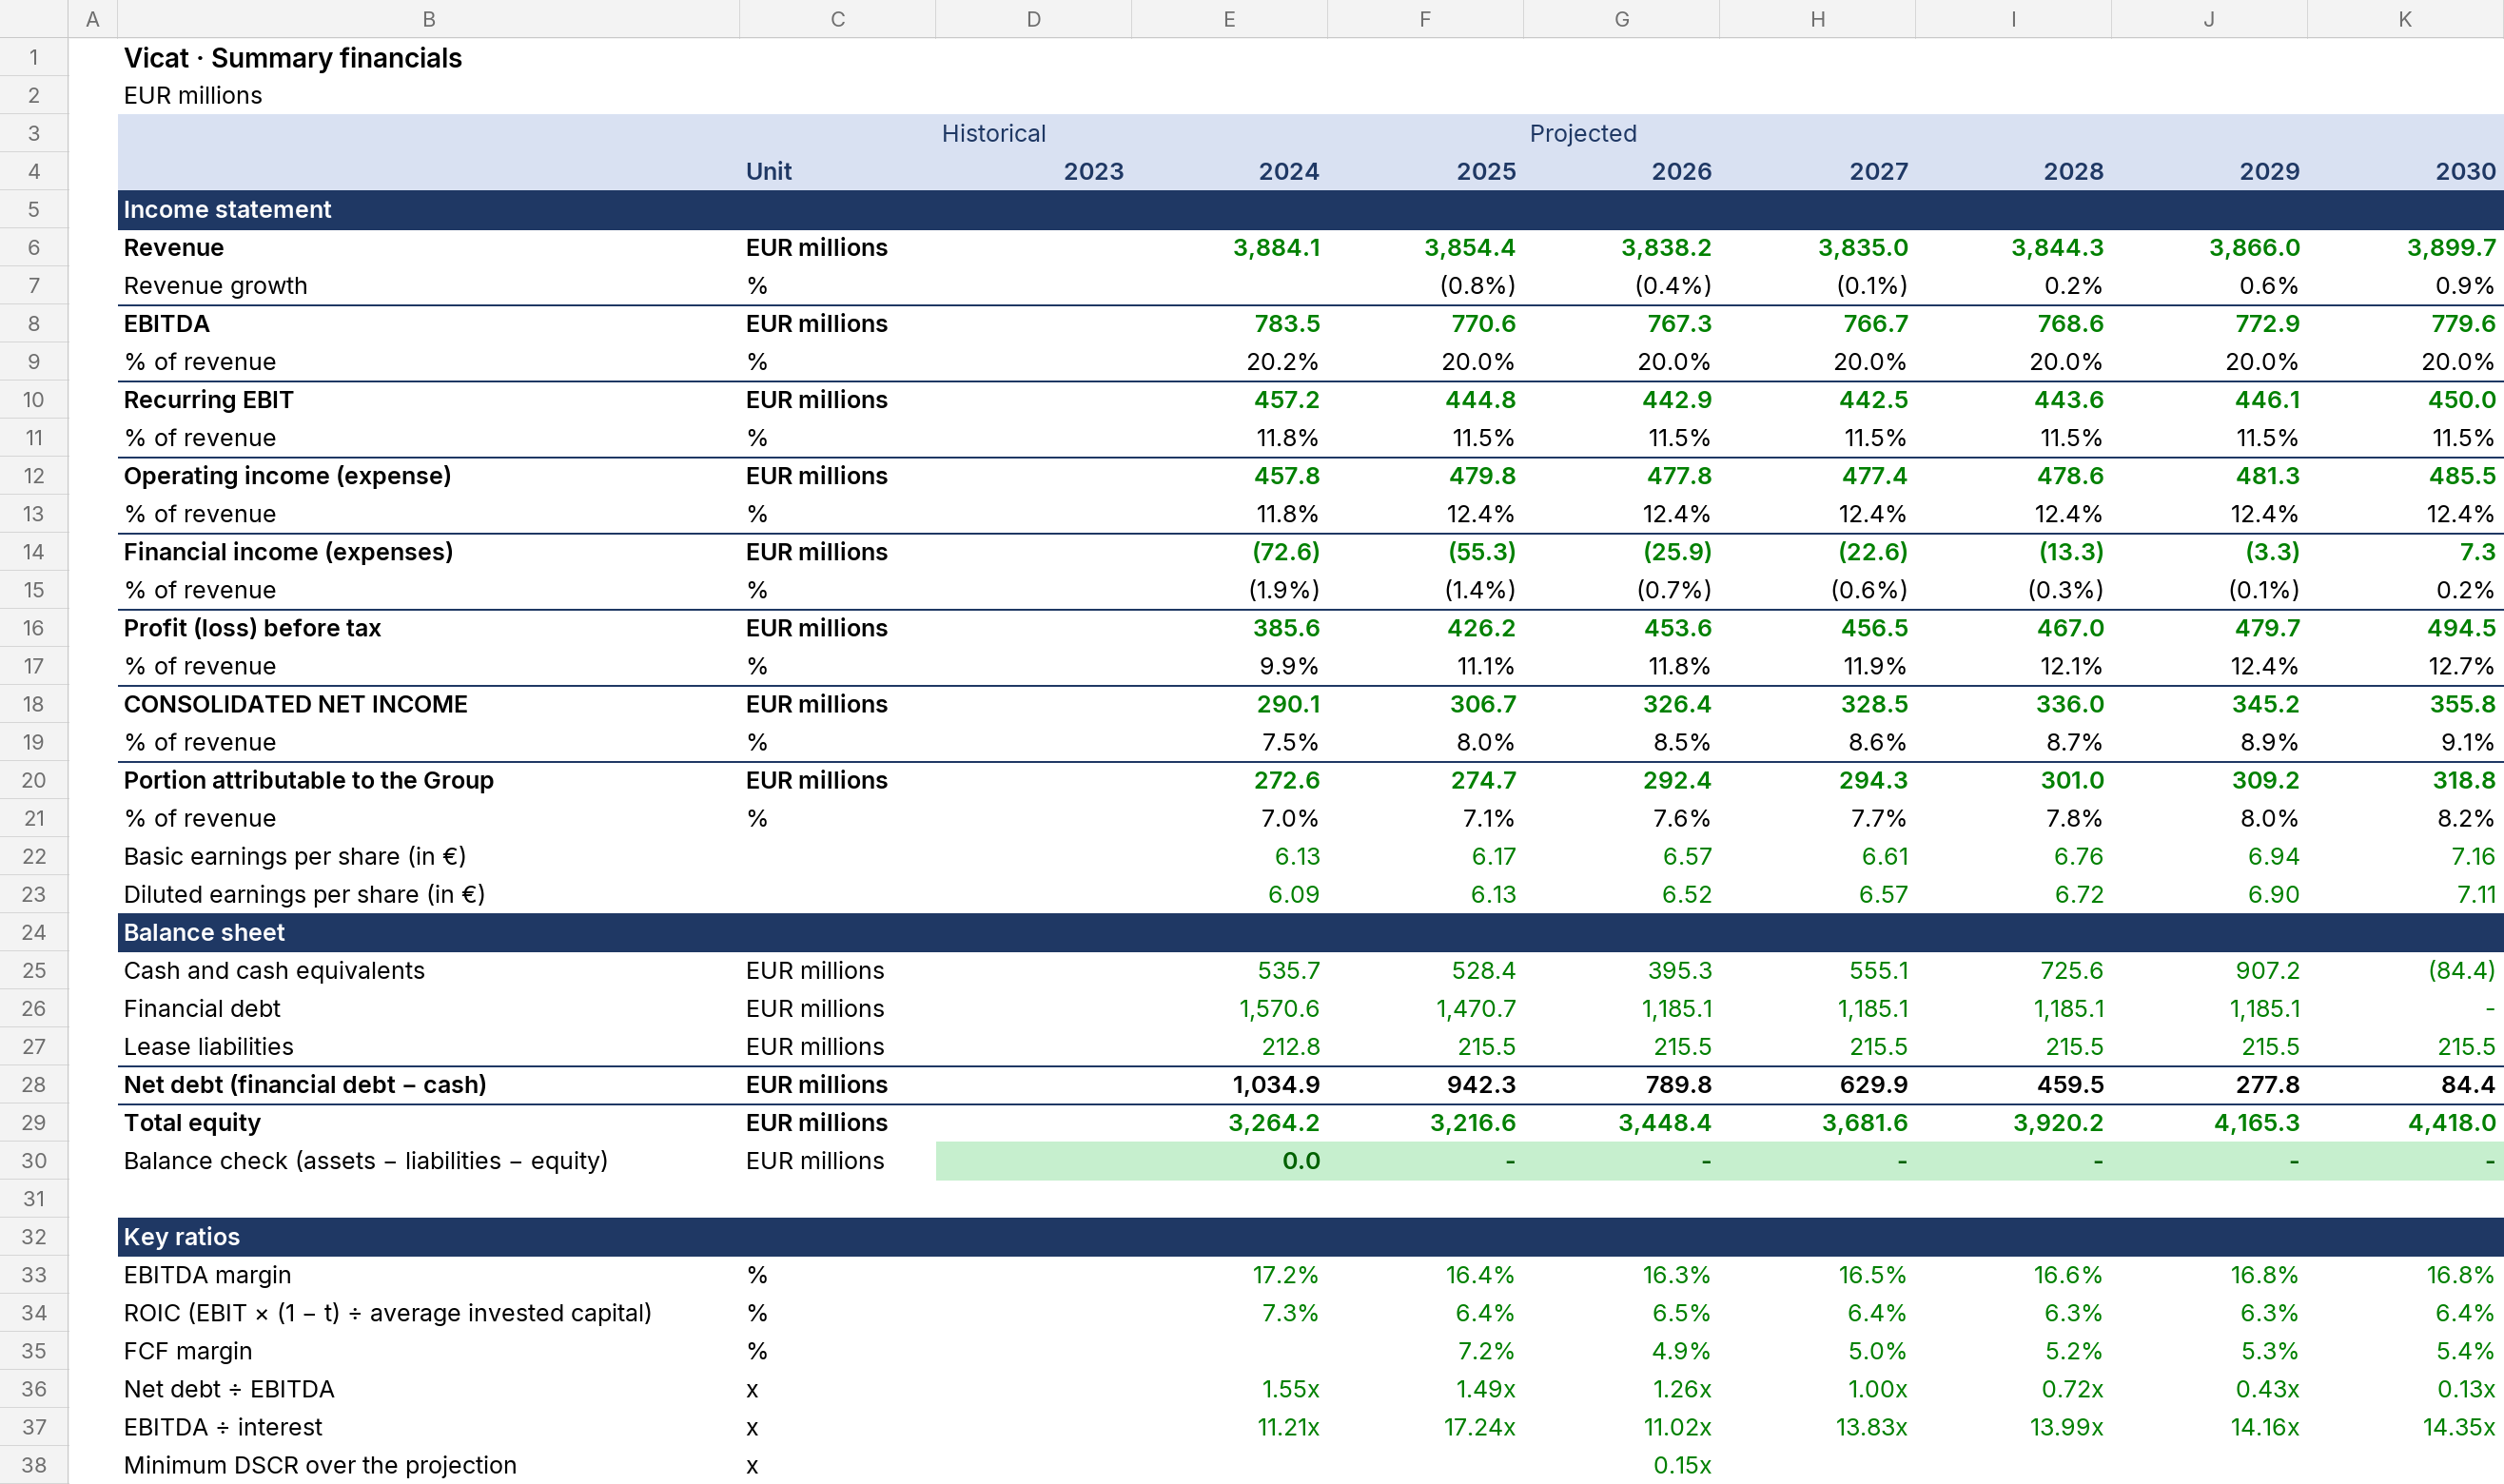
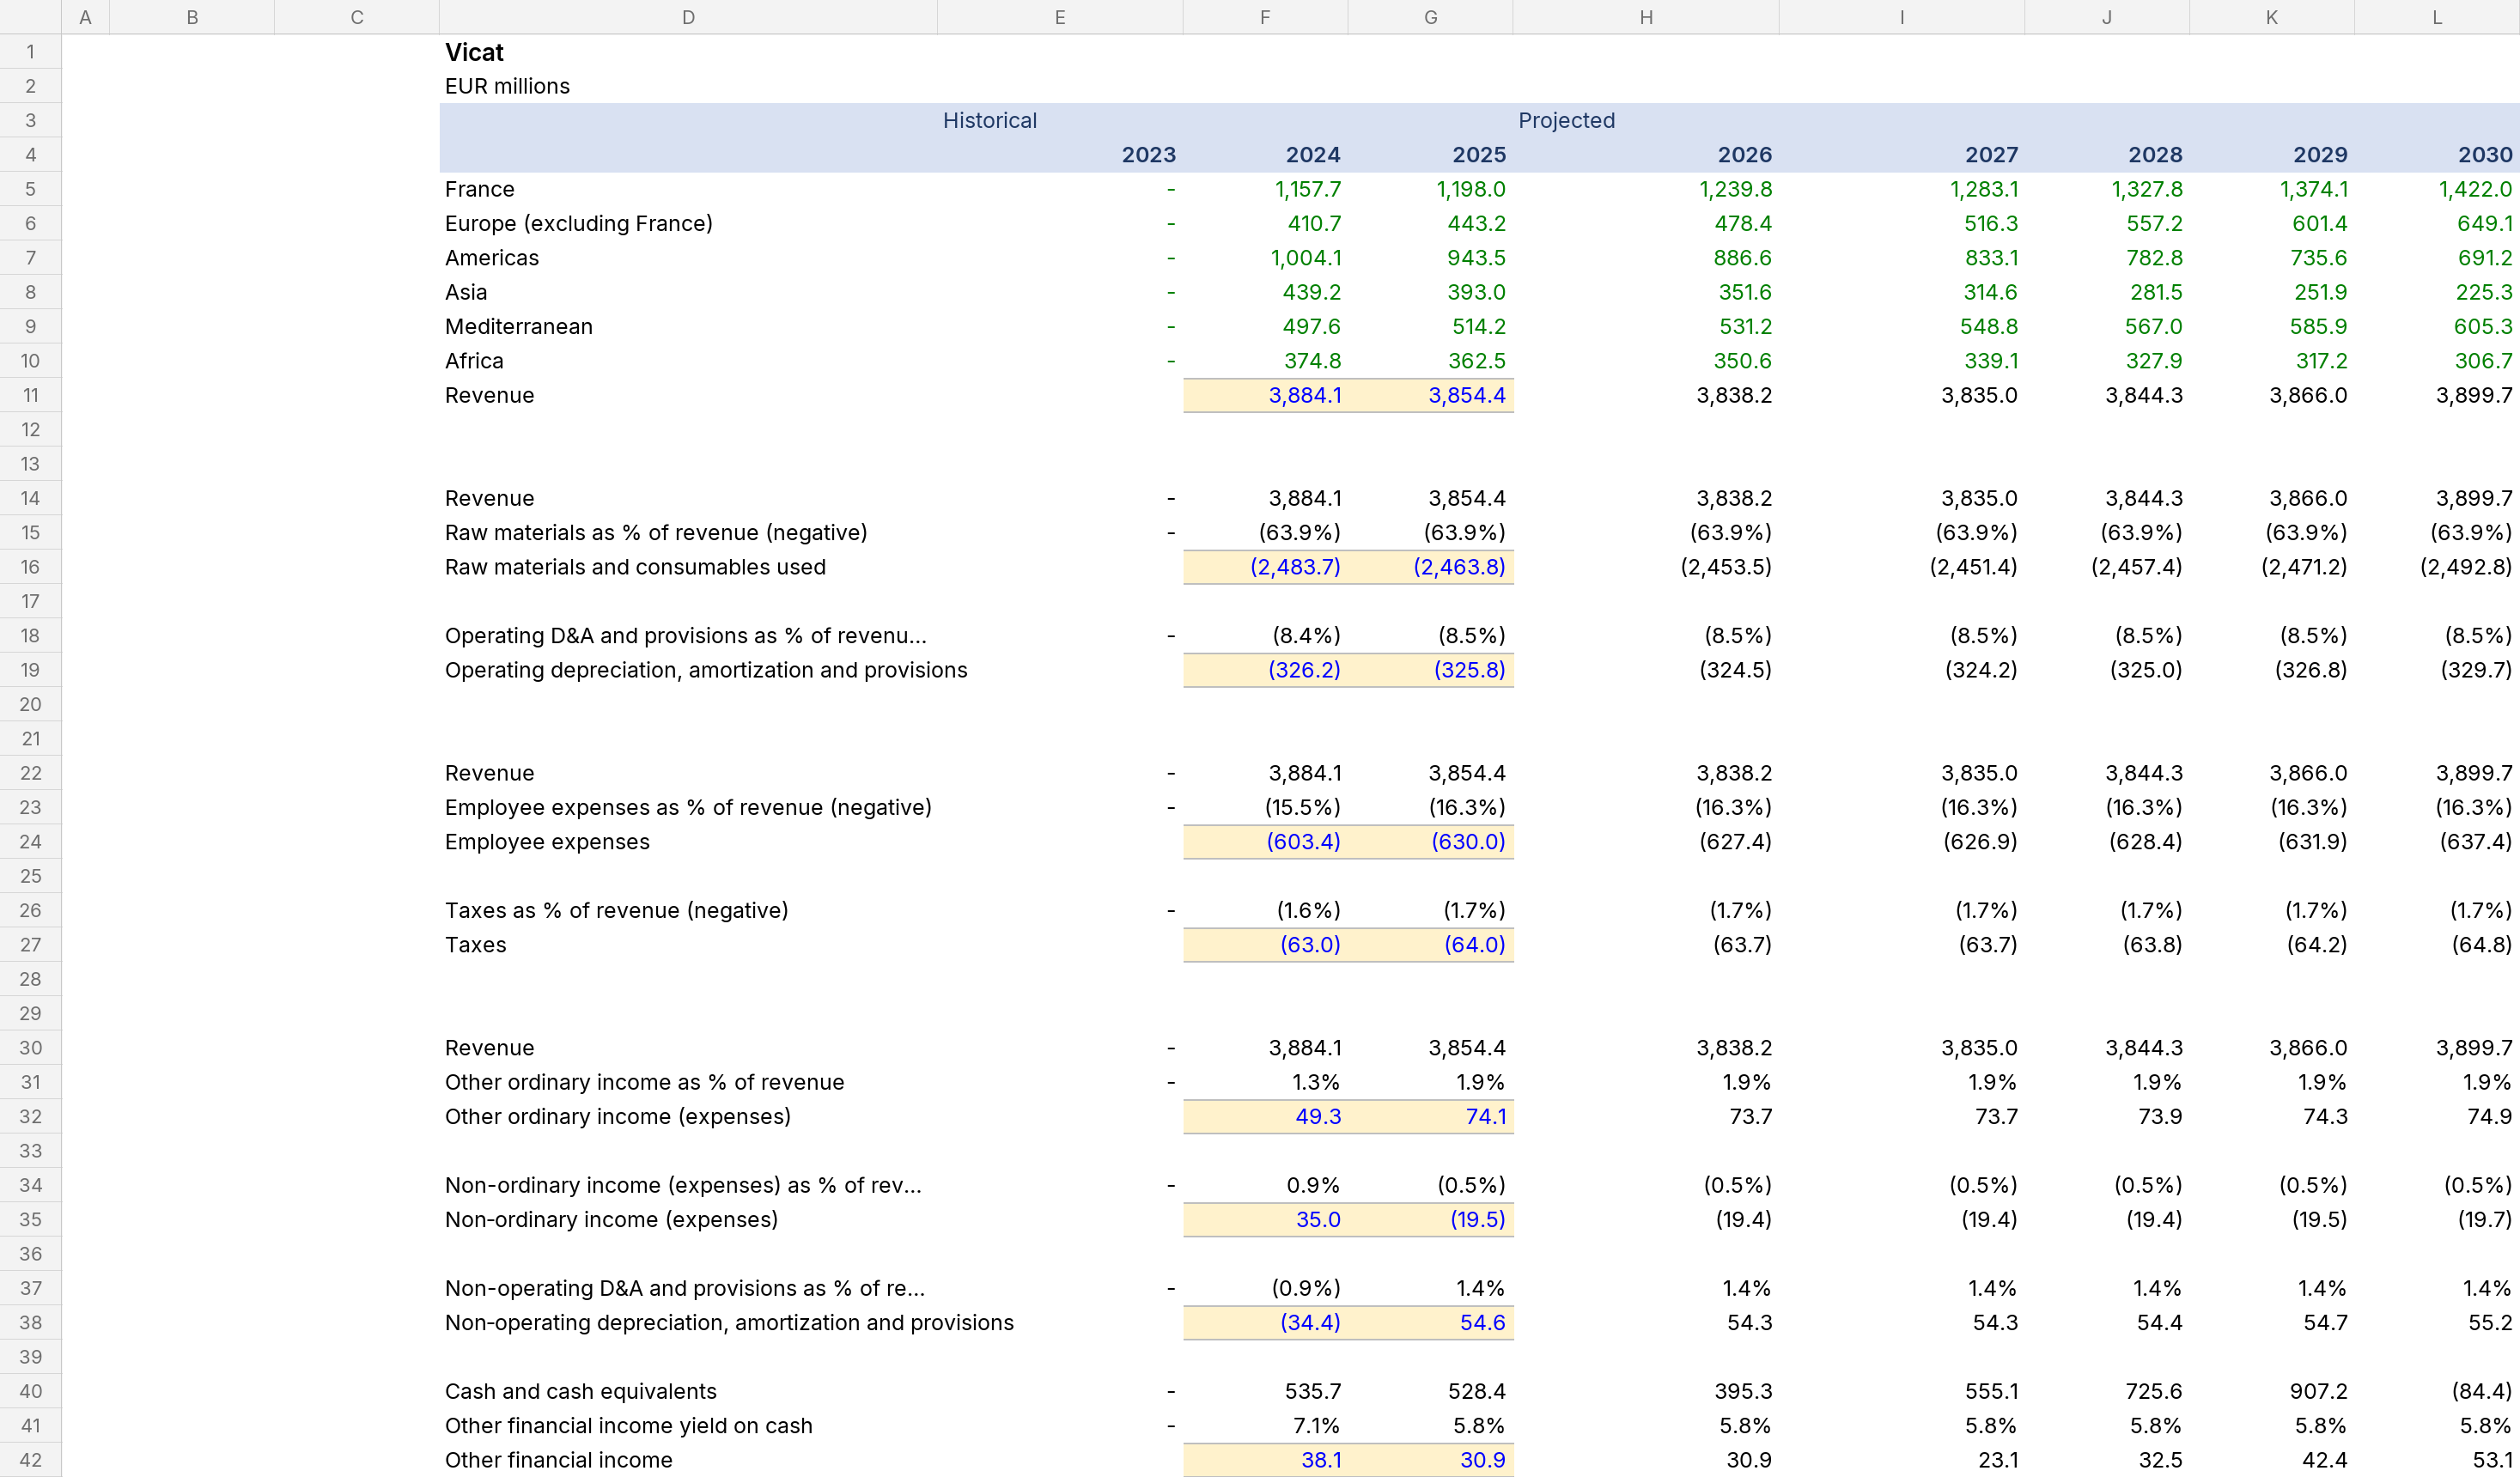
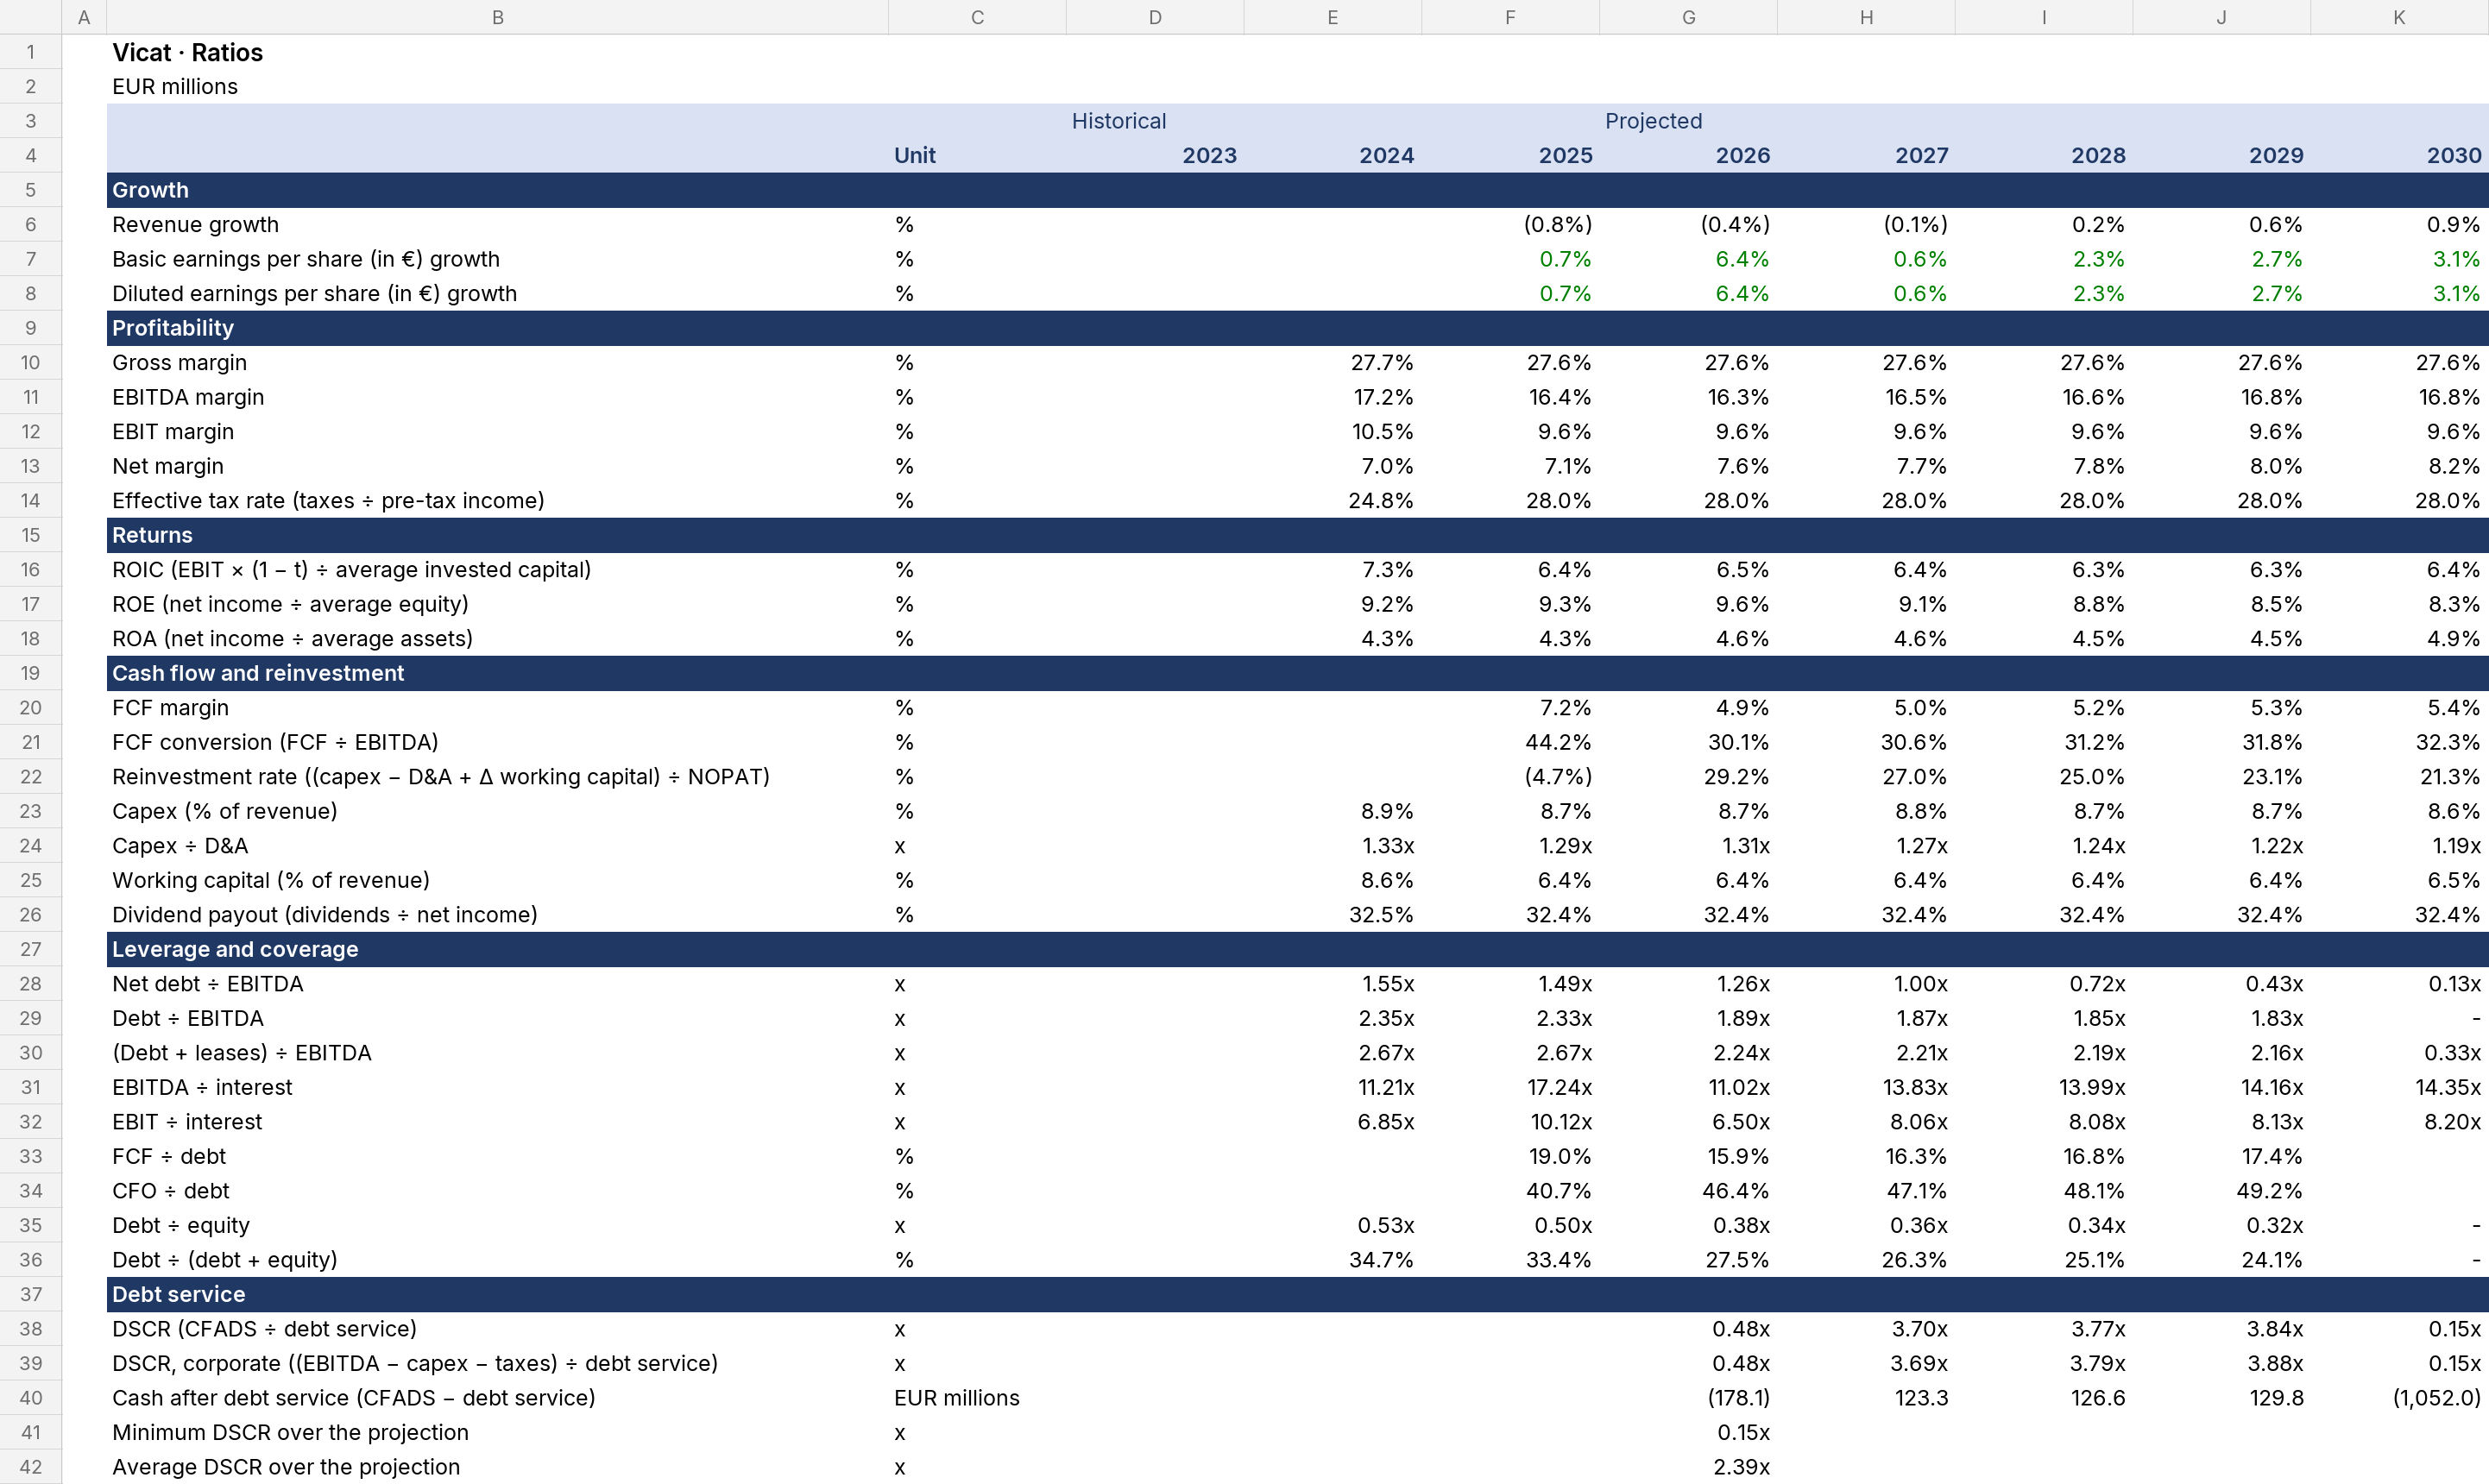
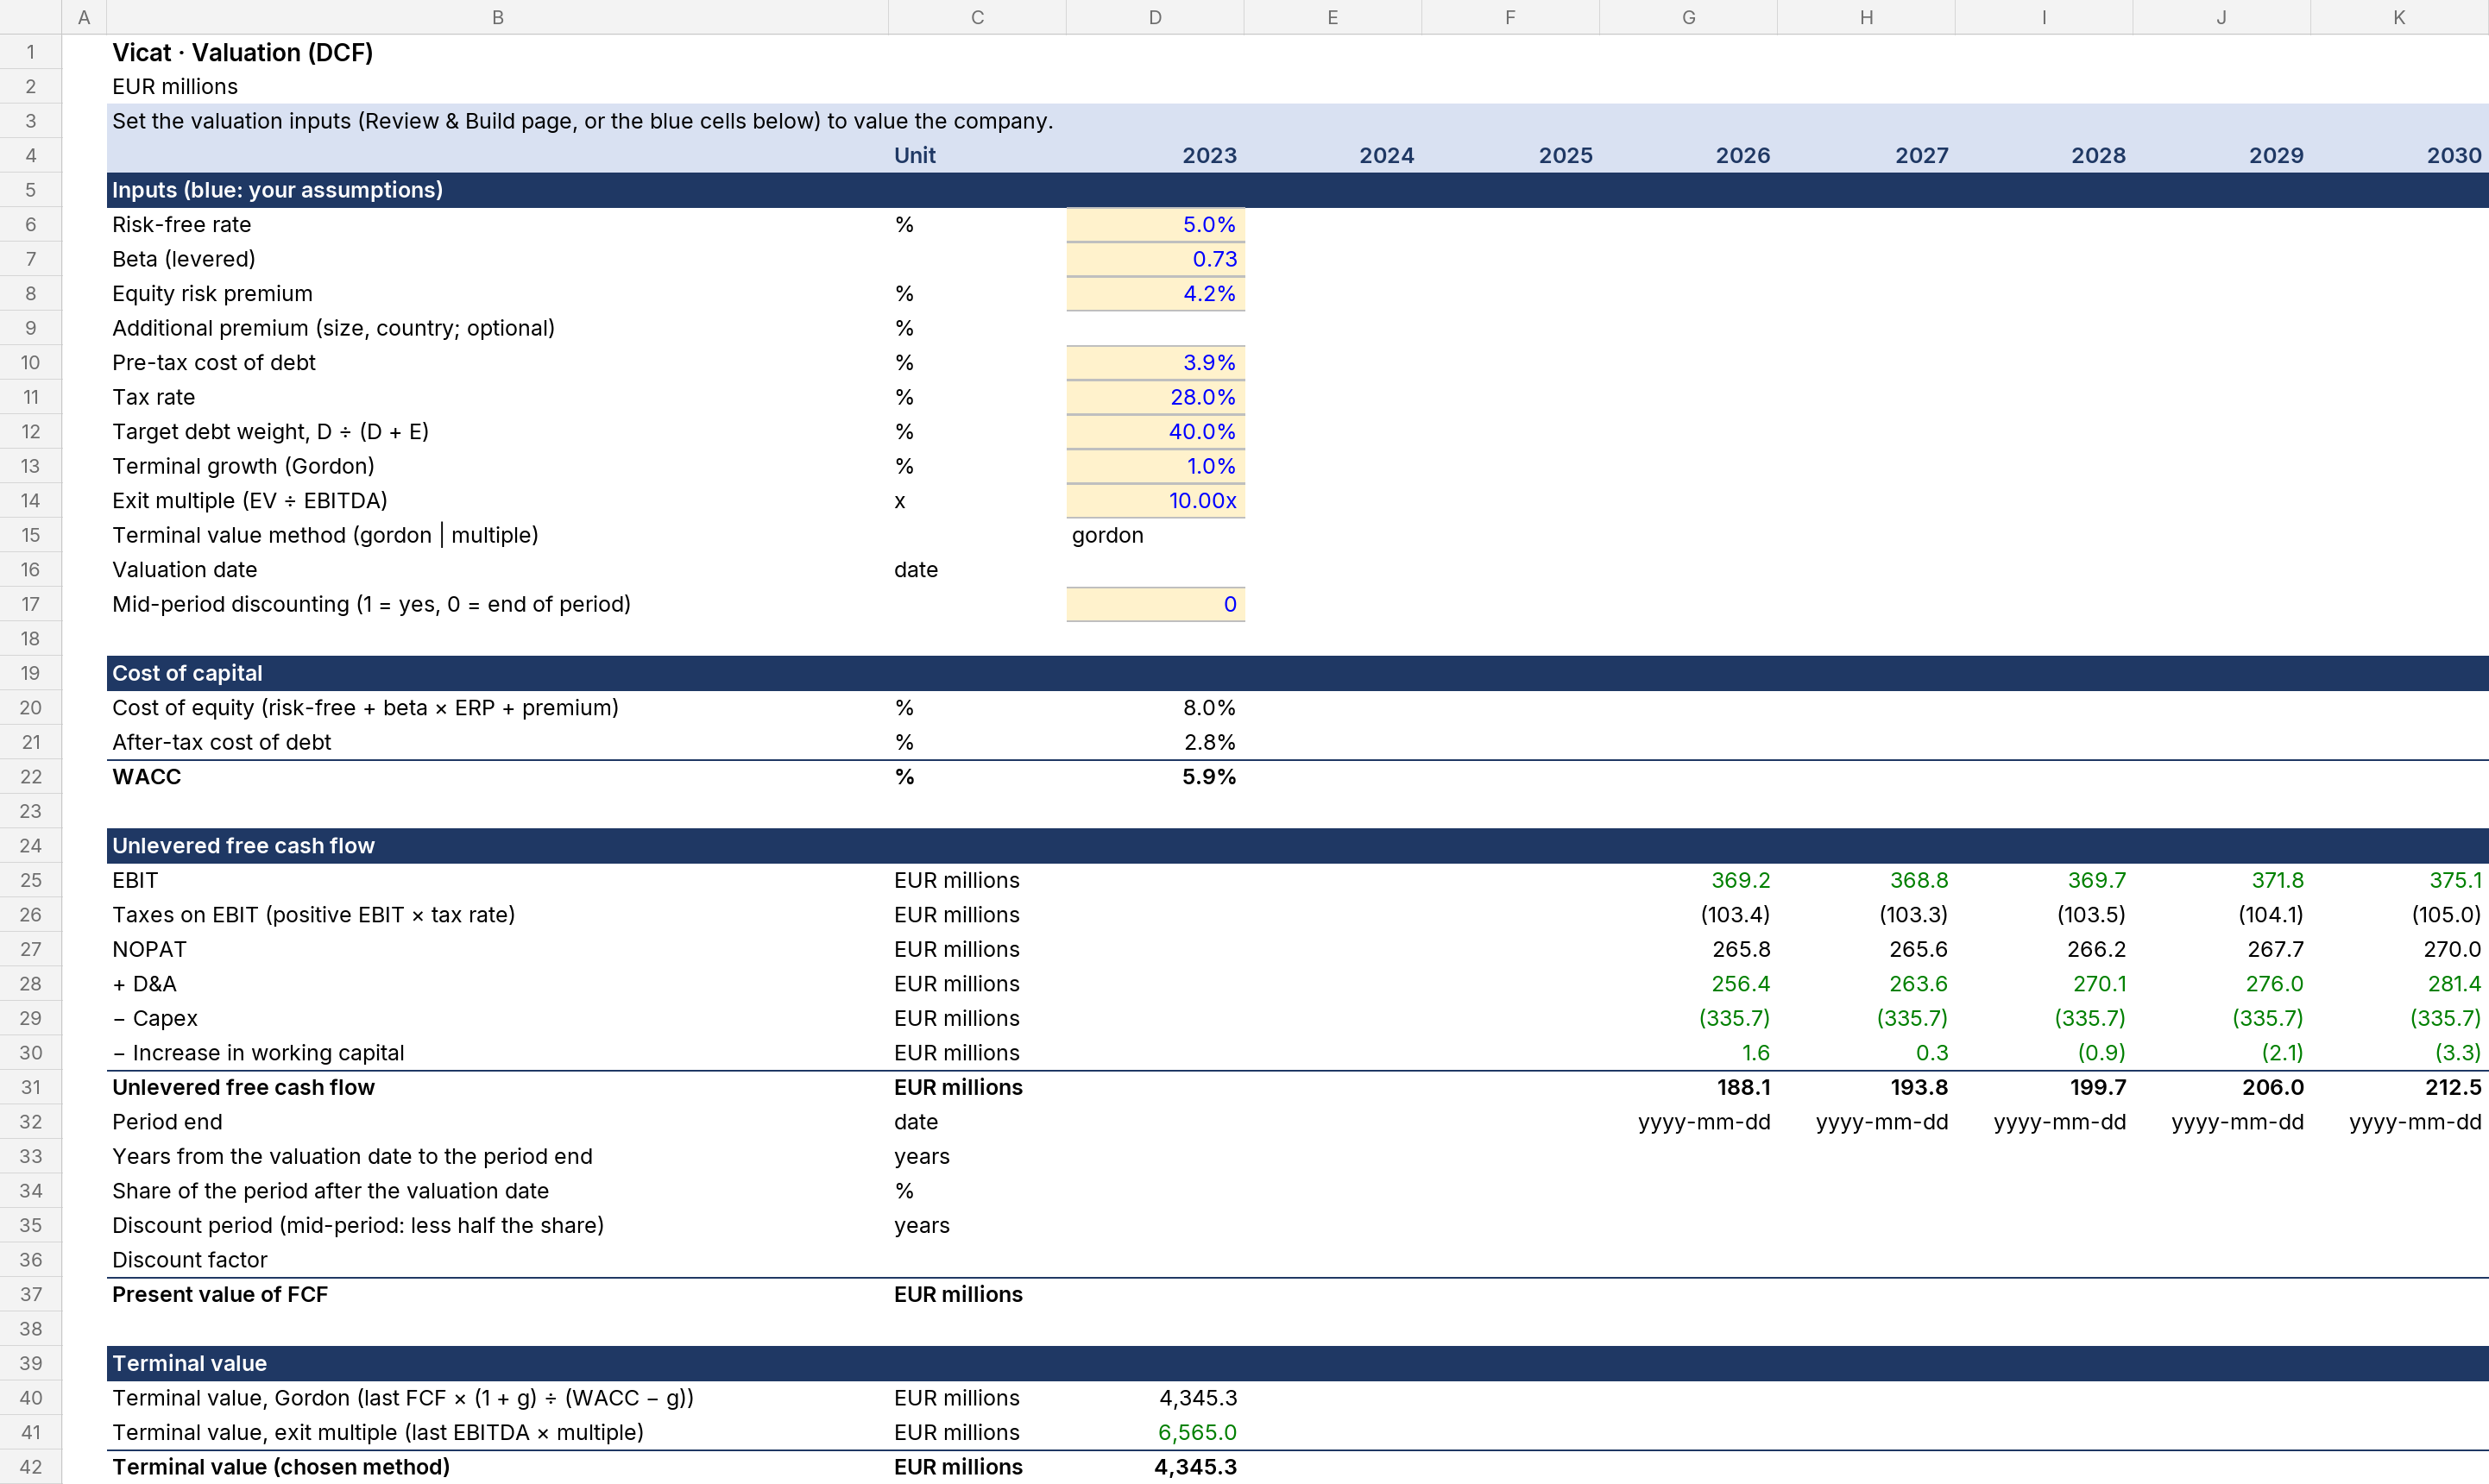
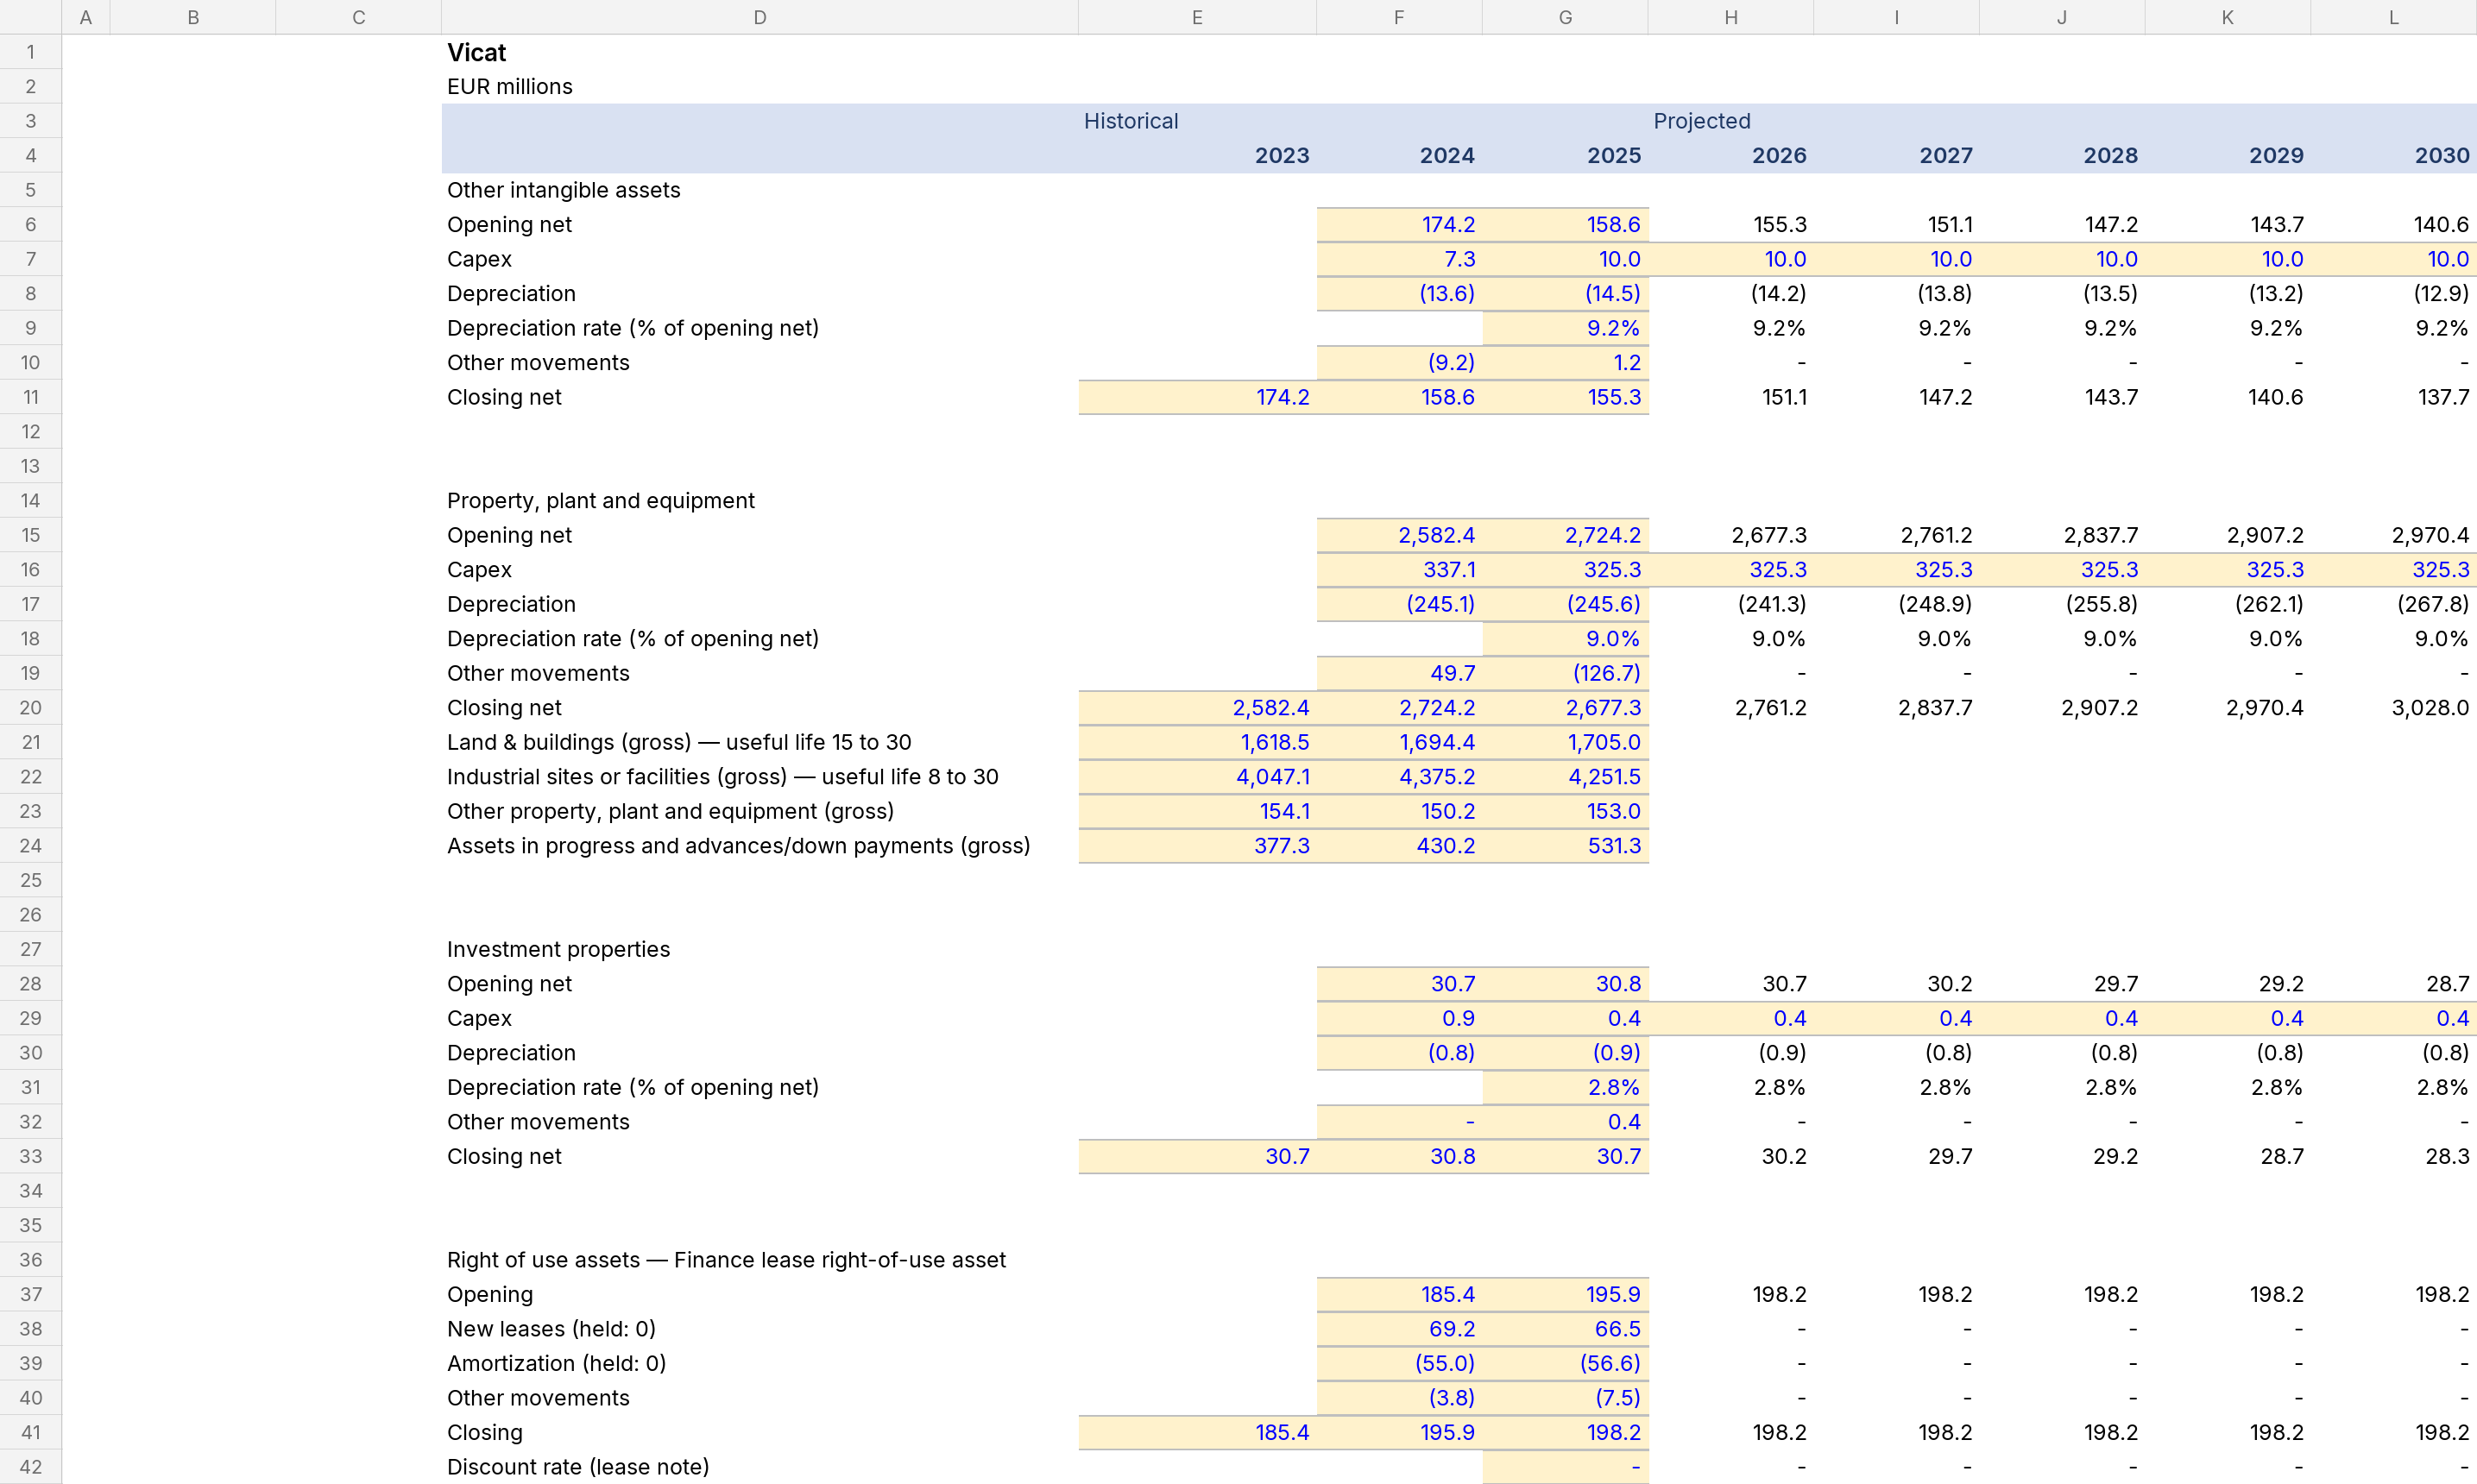
Vicat Group summary financials
EUR millions · historical and projected years 2023–2030. From the model's Summary sheet; every projected figure is a formula in the Excel.
| Historical | Projected | ||||||||
|---|---|---|---|---|---|---|---|---|---|
| EUR millions | Unit | 2023 | 2024 | 2025 | 2026E | 2027E | 2028E | 2029E | 2030E |
| Income statement | |||||||||
| Revenue | EUR millions | 3,884.1 | 3,854.4 | 3,838.2 | 3,835.0 | 3,844.3 | 3,866.0 | 3,899.7 | |
| Revenue growth | % | (0.8%) | (0.4%) | (0.1%) | 0.2% | 0.6% | 0.9% | ||
| EBITDA | EUR millions | 783.5 | 770.6 | 767.3 | 766.7 | 768.6 | 772.9 | 779.6 | |
| % of revenue | % | 20.2% | 20.0% | 20.0% | 20.0% | 20.0% | 20.0% | 20.0% | |
| Recurring EBIT | EUR millions | 457.2 | 444.8 | 442.9 | 442.5 | 443.6 | 446.1 | 450.0 | |
| % of revenue | % | 11.8% | 11.5% | 11.5% | 11.5% | 11.5% | 11.5% | 11.5% | |
| Operating income (expense) | EUR millions | 457.8 | 479.8 | 477.8 | 477.4 | 478.6 | 481.3 | 485.5 | |
| % of revenue | % | 11.8% | 12.4% | 12.4% | 12.4% | 12.4% | 12.4% | 12.4% | |
| Financial income (expenses) | EUR millions | (72.6) | (55.3) | (25.9) | (22.6) | (13.3) | (3.3) | 7.3 | |
| % of revenue | % | (1.9%) | (1.4%) | (0.7%) | (0.6%) | (0.3%) | (0.1%) | 0.2% | |
| Profit (loss) before tax | EUR millions | 385.6 | 426.2 | 453.6 | 456.5 | 467.0 | 479.7 | 494.5 | |
| % of revenue | % | 9.9% | 11.1% | 11.8% | 11.9% | 12.1% | 12.4% | 12.7% | |
| CONSOLIDATED NET INCOME | EUR millions | 290.1 | 306.7 | 326.4 | 328.5 | 336.0 | 345.2 | 355.8 | |
| % of revenue | % | 7.5% | 8.0% | 8.5% | 8.6% | 8.7% | 8.9% | 9.1% | |
| Portion attributable to the Group | EUR millions | 272.6 | 274.7 | 292.4 | 294.3 | 301.0 | 309.2 | 318.8 | |
| % of revenue | % | 7.0% | 7.1% | 7.6% | 7.7% | 7.8% | 8.0% | 8.2% | |
| Basic earnings per share (in €) | 6.13 | 6.17 | 6.57 | 6.61 | 6.76 | 6.94 | 7.16 | ||
| Diluted earnings per share (in €) | 6.09 | 6.13 | 6.52 | 6.57 | 6.72 | 6.90 | 7.11 | ||
| Balance sheet | |||||||||
| Cash and cash equivalents | EUR millions | 535.7 | 528.4 | 395.3 | 555.1 | 725.6 | 907.2 | (84.4) | |
| Financial debt | EUR millions | 1,570.6 | 1,470.7 | 1,185.1 | 1,185.1 | 1,185.1 | 1,185.1 | - | |
| Lease liabilities | EUR millions | 212.8 | 215.5 | 215.5 | 215.5 | 215.5 | 215.5 | 215.5 | |
| Net debt (financial debt − cash) | EUR millions | 1,034.9 | 942.3 | 789.8 | 629.9 | 459.5 | 277.8 | 84.4 | |
| Total equity | EUR millions | 3,264.2 | 3,216.6 | 3,448.4 | 3,681.6 | 3,920.2 | 4,165.3 | 4,418.0 | |
| Balance check (assets − liabilities − equity) | EUR millions | 0.0 | - | - | - | - | - | - | |
| Key ratios | |||||||||
| EBITDA margin | % | 17.2% | 16.4% | 16.3% | 16.5% | 16.6% | 16.8% | 16.8% | |
| ROIC (EBIT × (1 − t) ÷ average invested capital) | % | 7.3% | 6.4% | 6.5% | 6.4% | 6.3% | 6.3% | 6.4% | |
| FCF margin | % | 7.2% | 4.9% | 5.0% | 5.2% | 5.3% | 5.4% | ||
| Net debt ÷ EBITDA | x | 1.55x | 1.49x | 1.26x | 1.00x | 0.72x | 0.43x | 0.13x | |
| EBITDA ÷ interest | x | 11.21x | 17.24x | 11.02x | 13.83x | 13.99x | 14.16x | 14.35x | |
| Minimum DSCR over the projection | x | 0.15x | |||||||
How revenue is built
Skale reads the documents to decide how each revenue stream is projected, and explains why.
No volume or capacity history is reported for France. Group-wide volumes cannot drive a single regional stream. The existing growth build, with the growth rate held, is the best the documents support.
No regional volumes are disclosed, so growth with the rate held is kept.
Volumes are partial and cover one year only, so they cannot drive the whole region. Growth with the rate held is kept.
No volume history is available for Asia, so growth with the rate held is kept.
Volumes cover only part of the region, and revenue is heavily affected by currency and hyperinflation. Growth with the rate held is kept.
No full regional volume history is reported, so growth with the rate held is kept.
Build this for your company
Upload your financial statements; Skale builds the model, and you review the assumptions.
Get startedNew to financial models? What is a financial model?