Space X financial model
This Excel financial model of Space Exploration Technologies (Space X) was built automatically by Skale, an AI tool that builds financial models from financial statements, using 6 published documents. It is a three-statement model covering the income statement, balance sheet and cash flow, with 10 projected years from Sep-27E to Sep-36E, across the sheets Summary, Main, Ratios, Valuation, Support and Schedules. For the last twelve months to Sep-26, the model shows revenue of $32.0 billion, up 71.6% on 2025, net income to shareholders of -$985.0 million, and net cash of $12.4 billion.
Preview the Excel
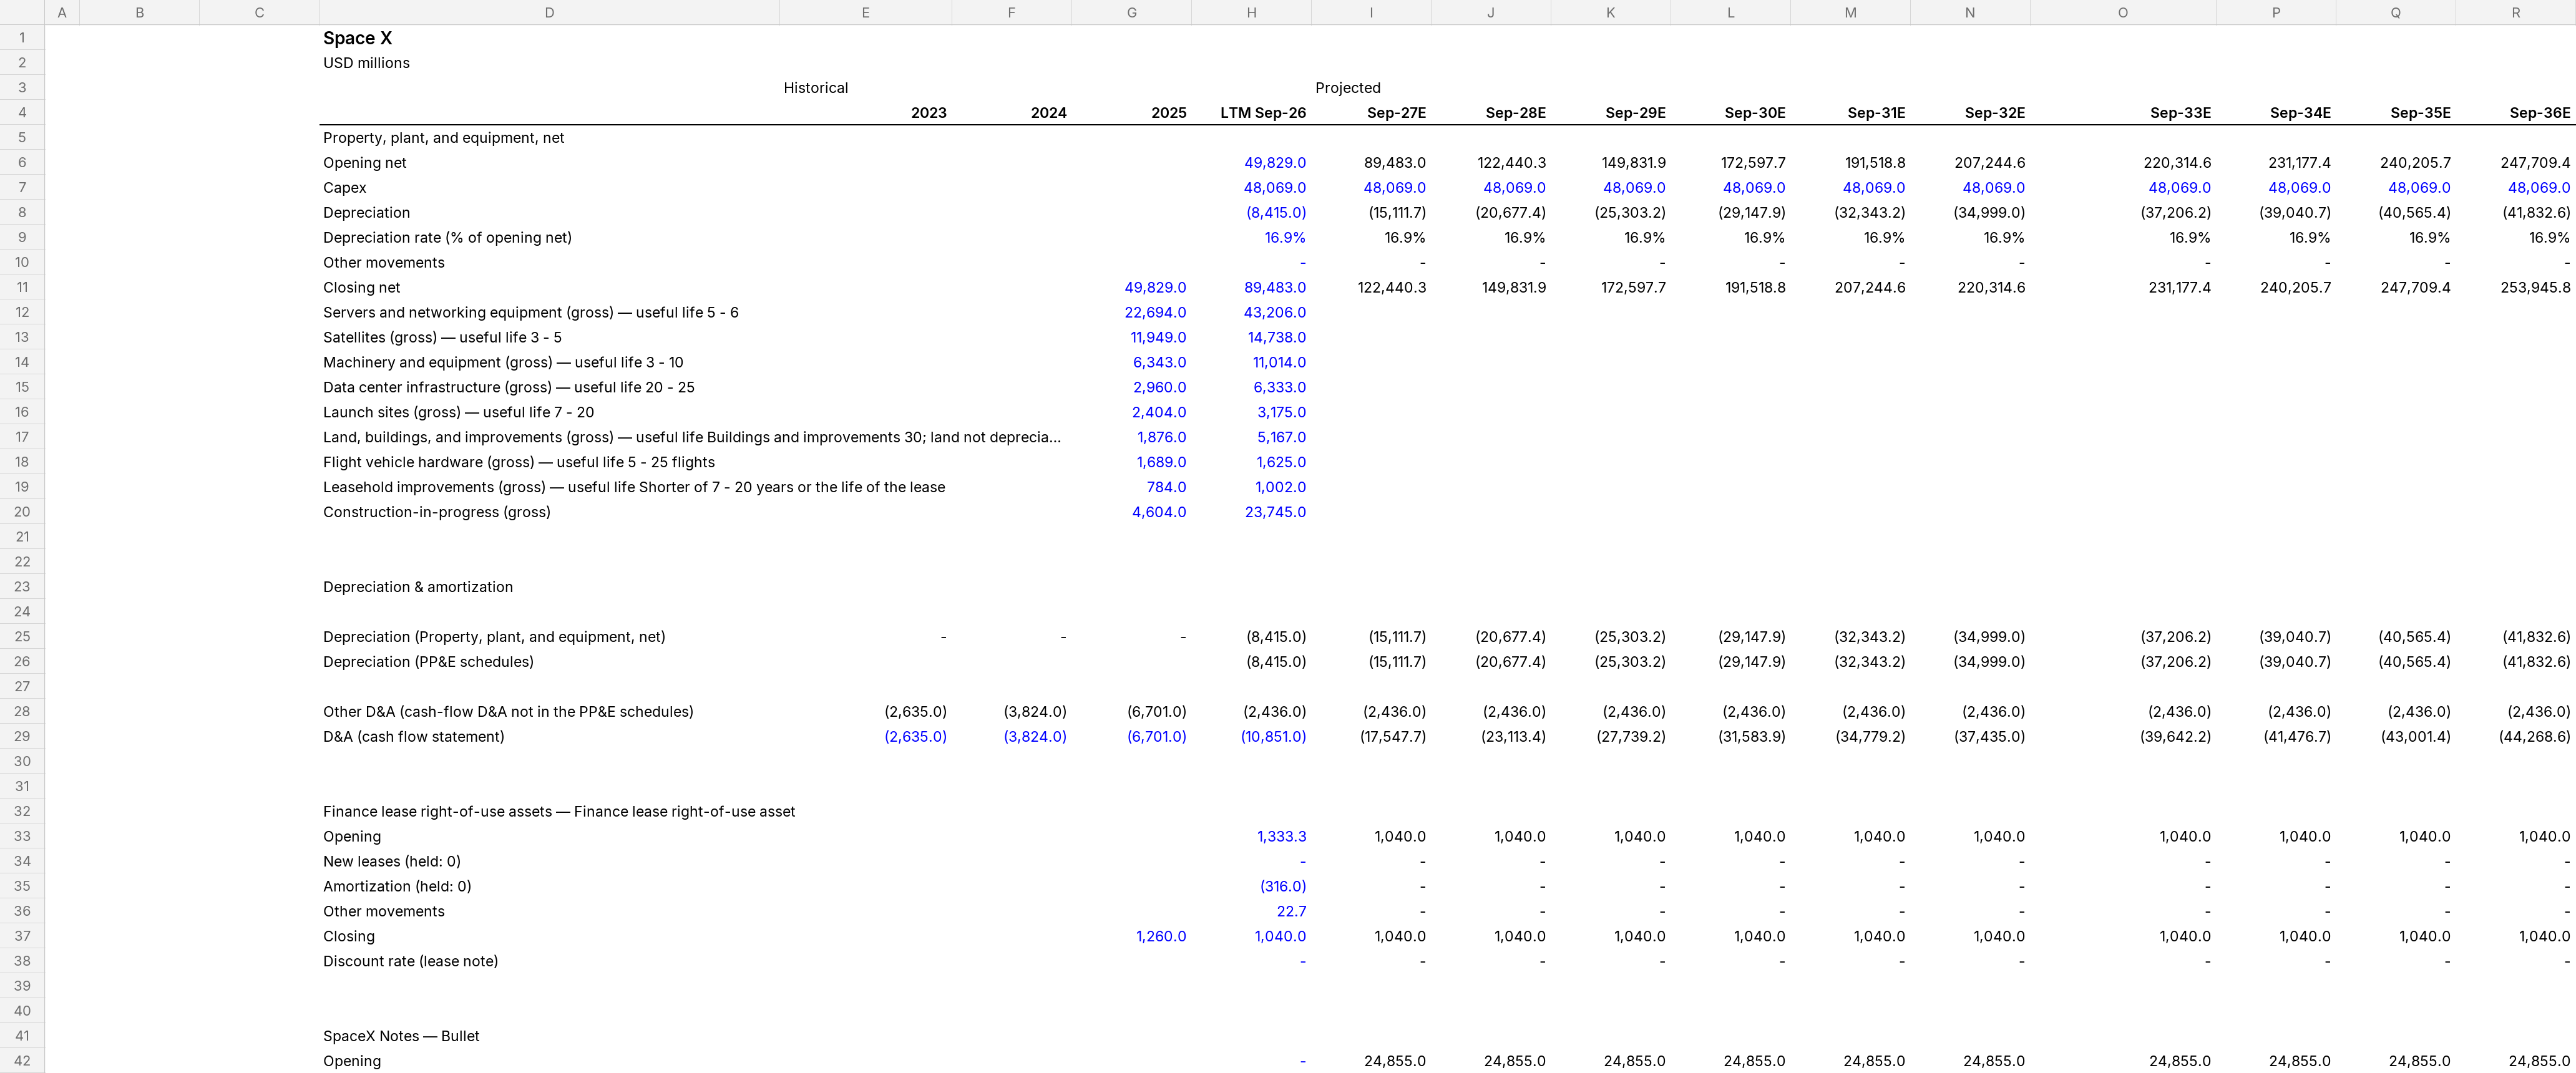
The first rows of each sheet, as they open in Excel.
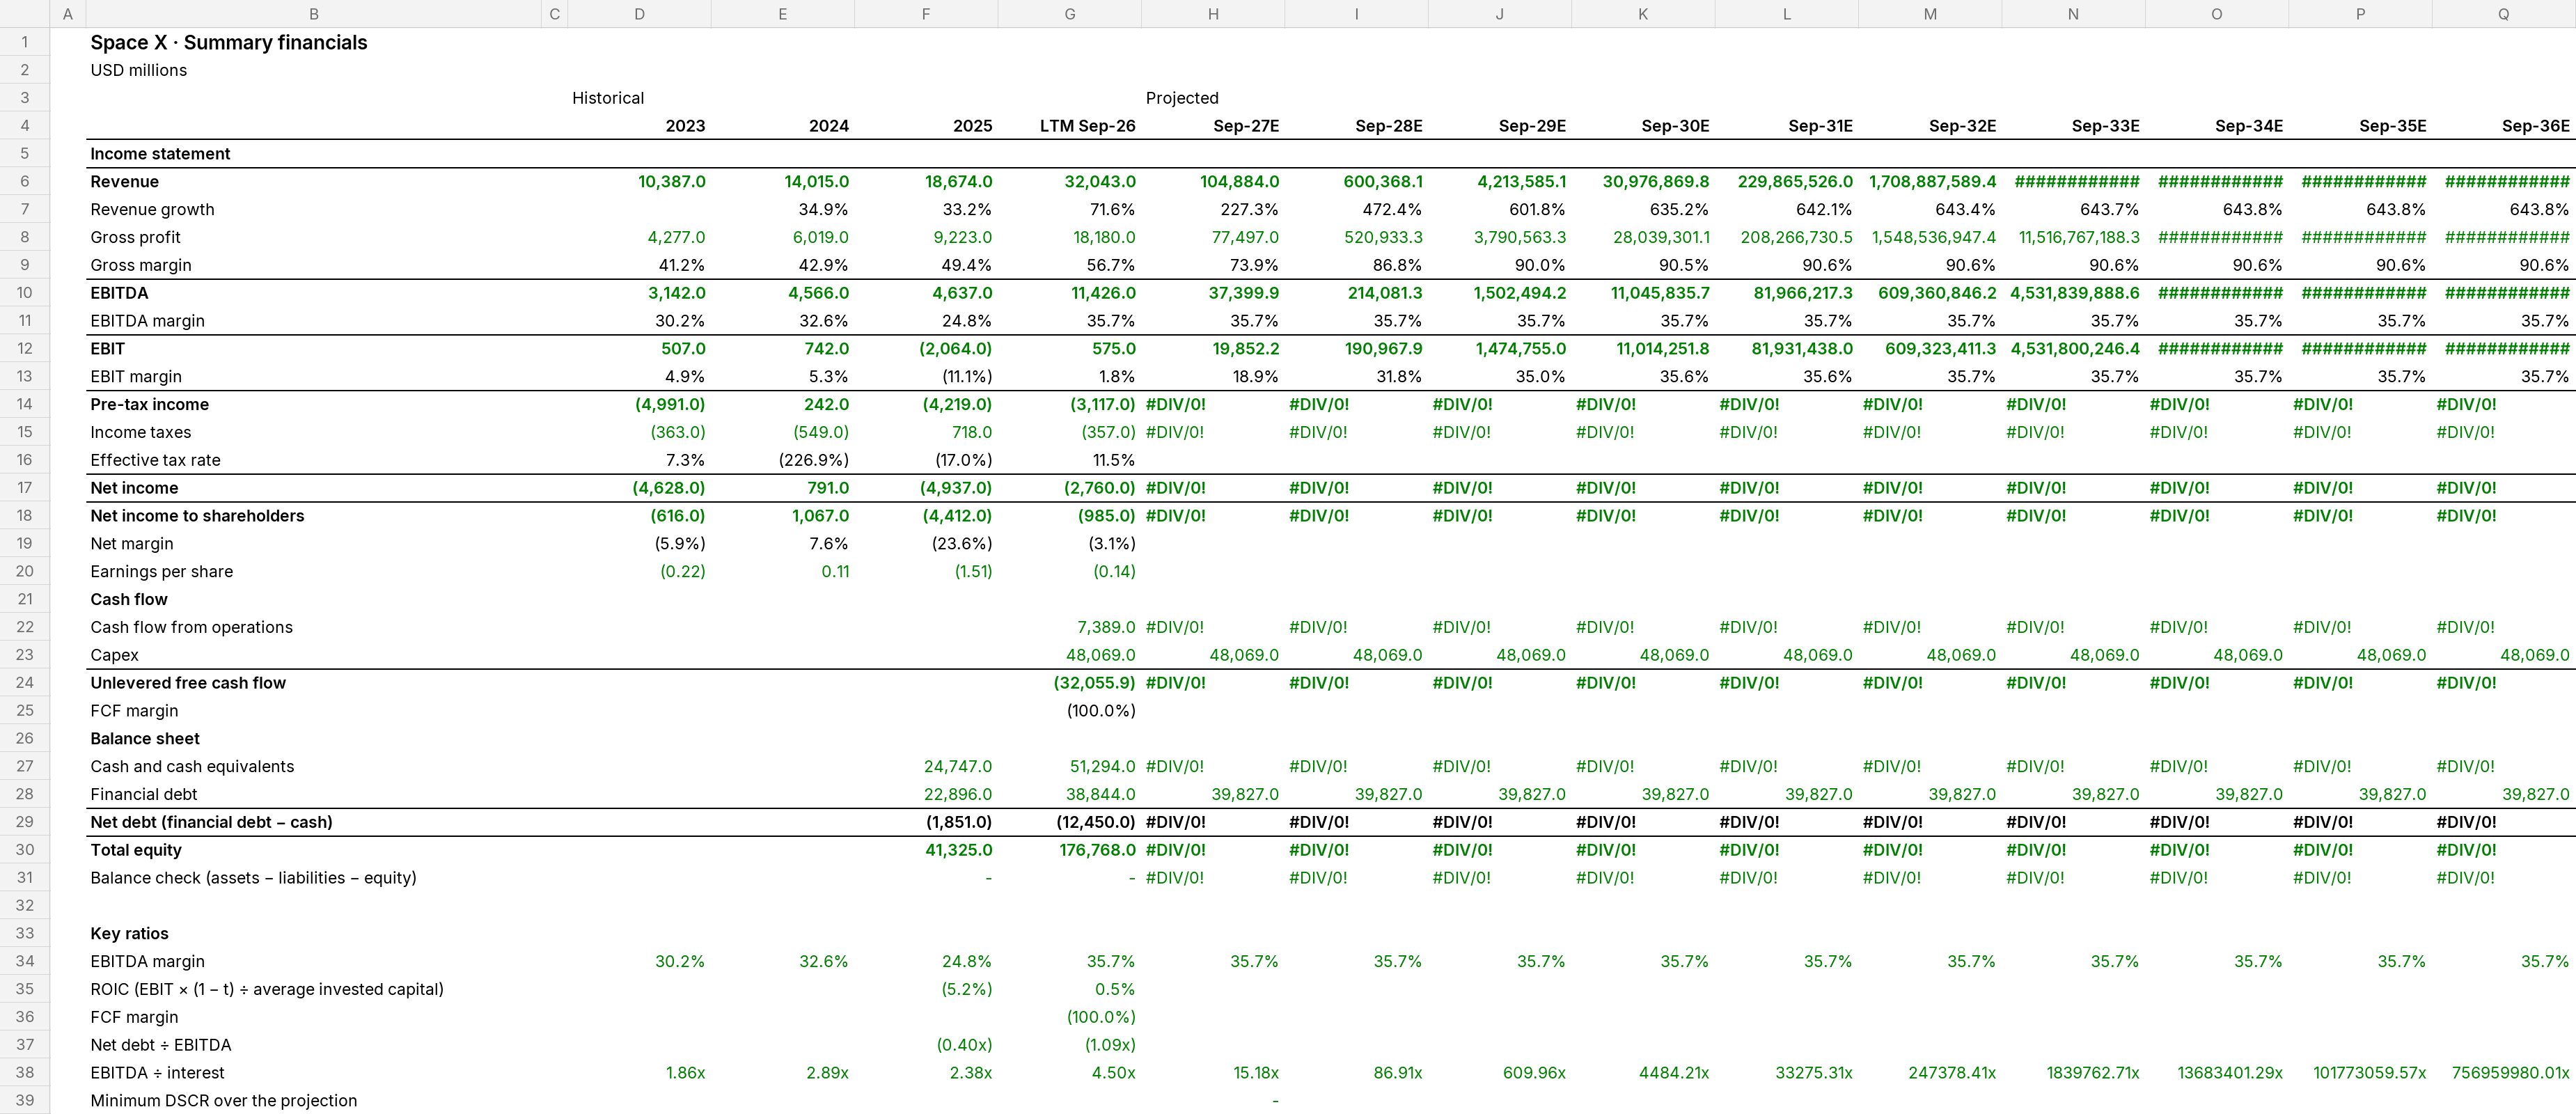
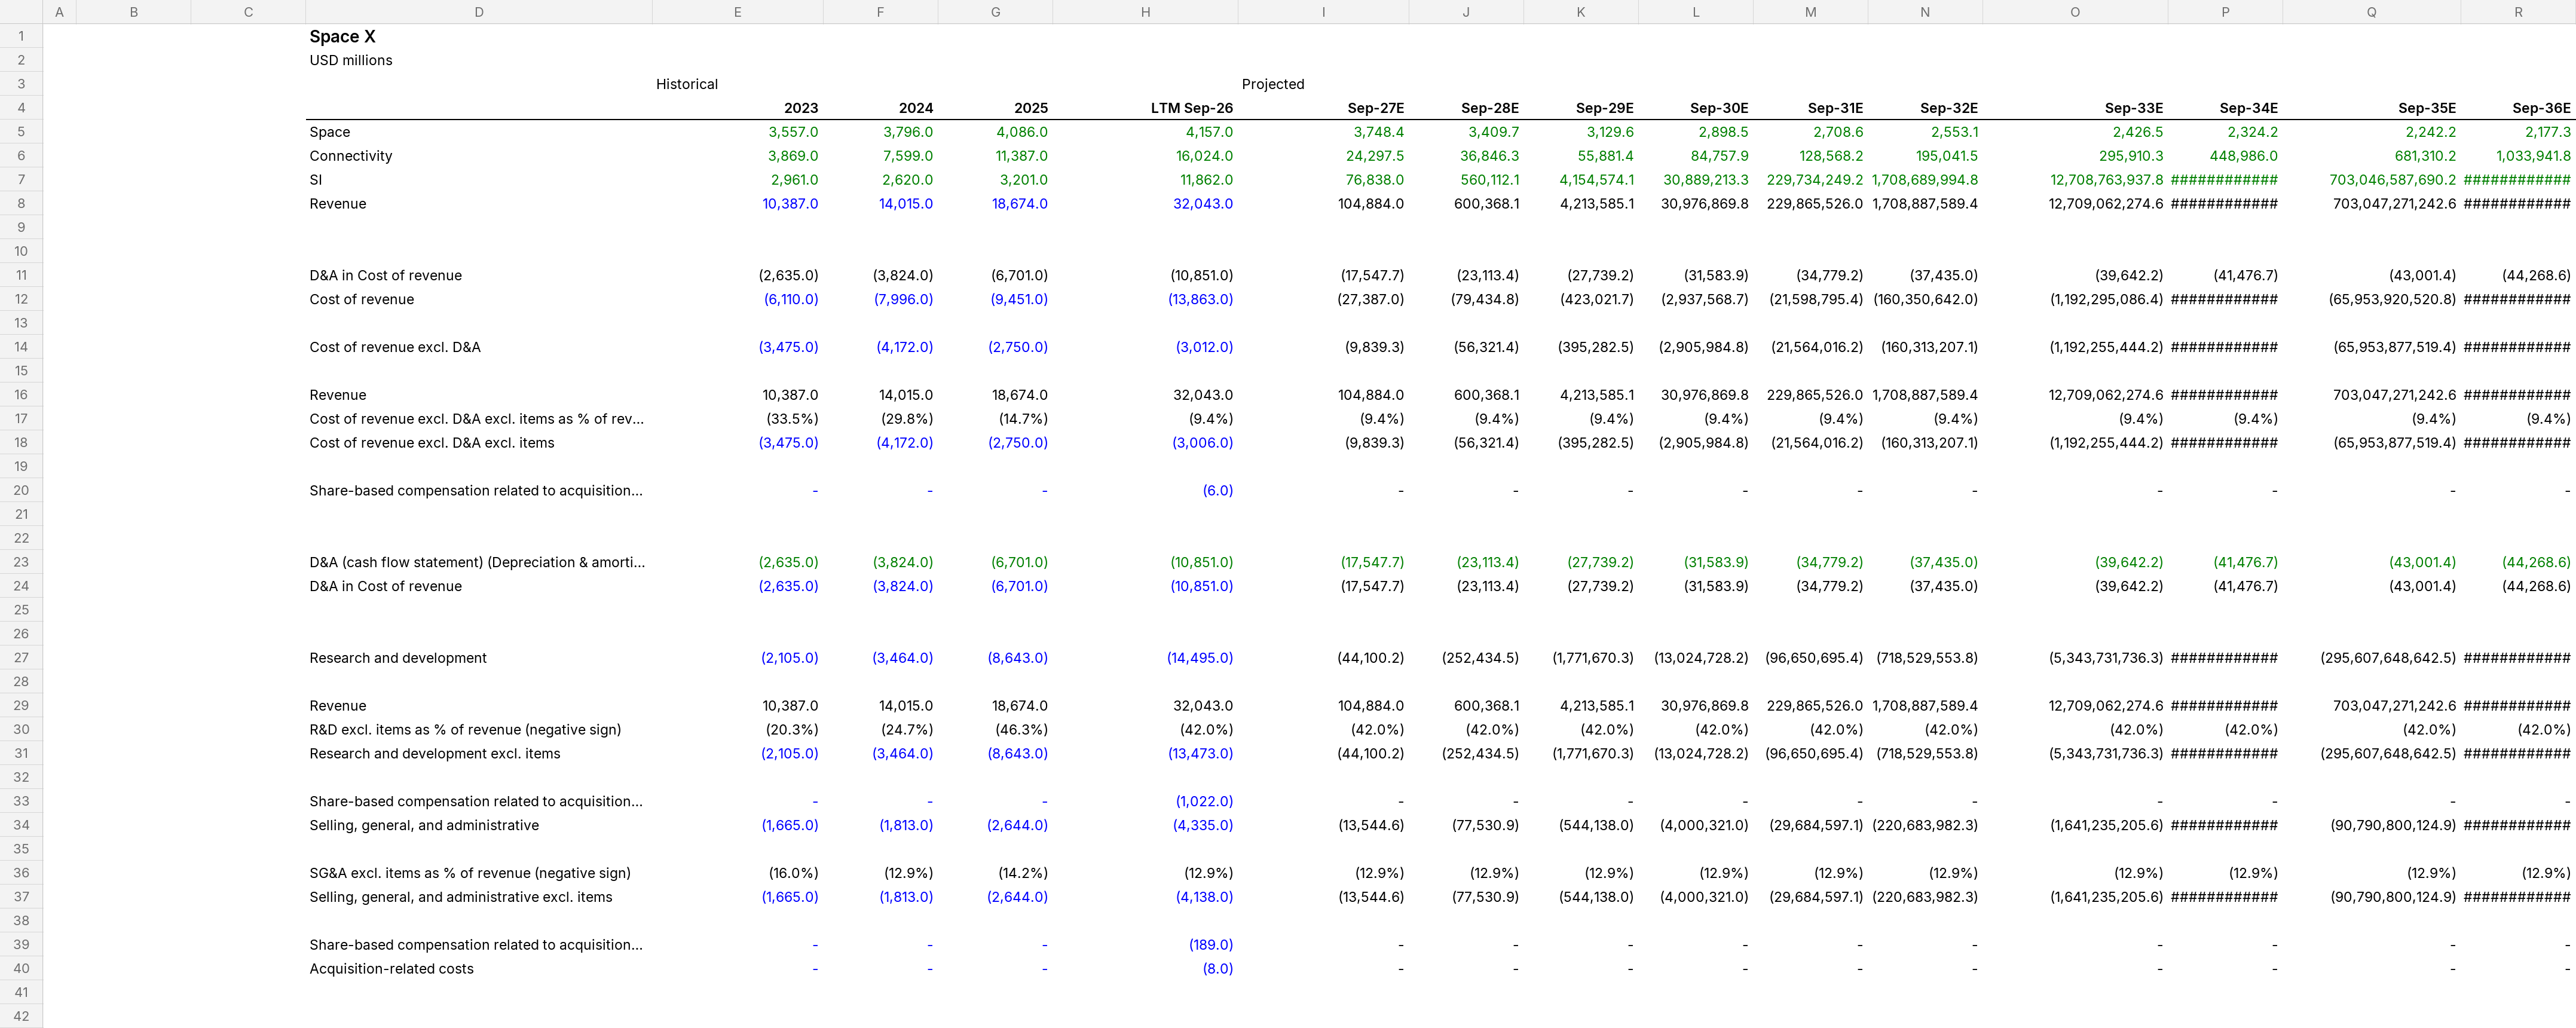
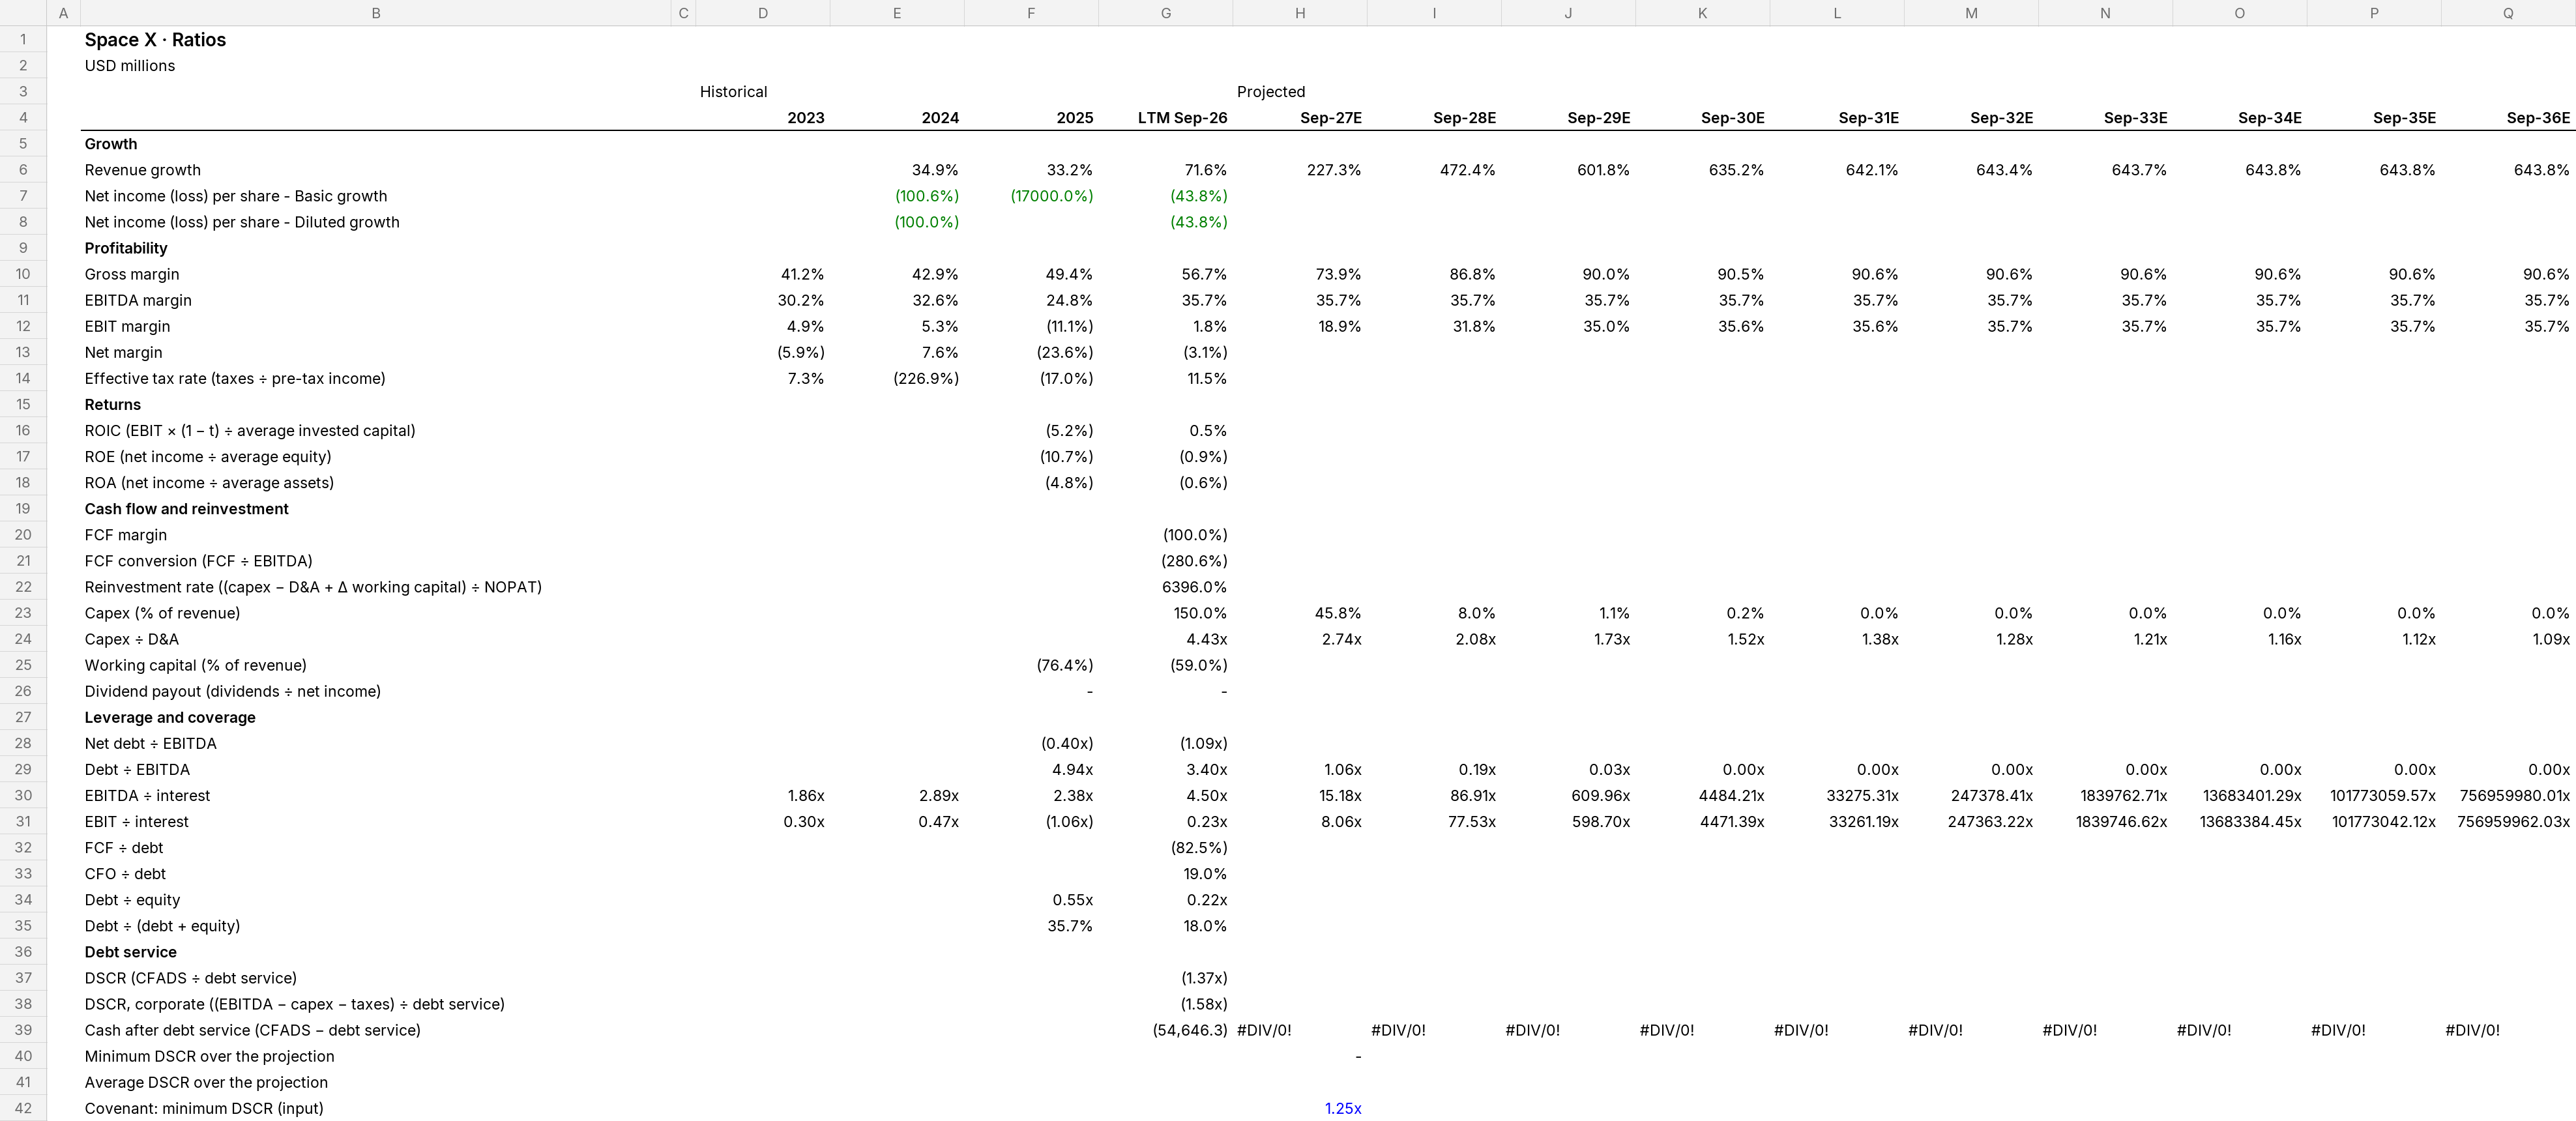
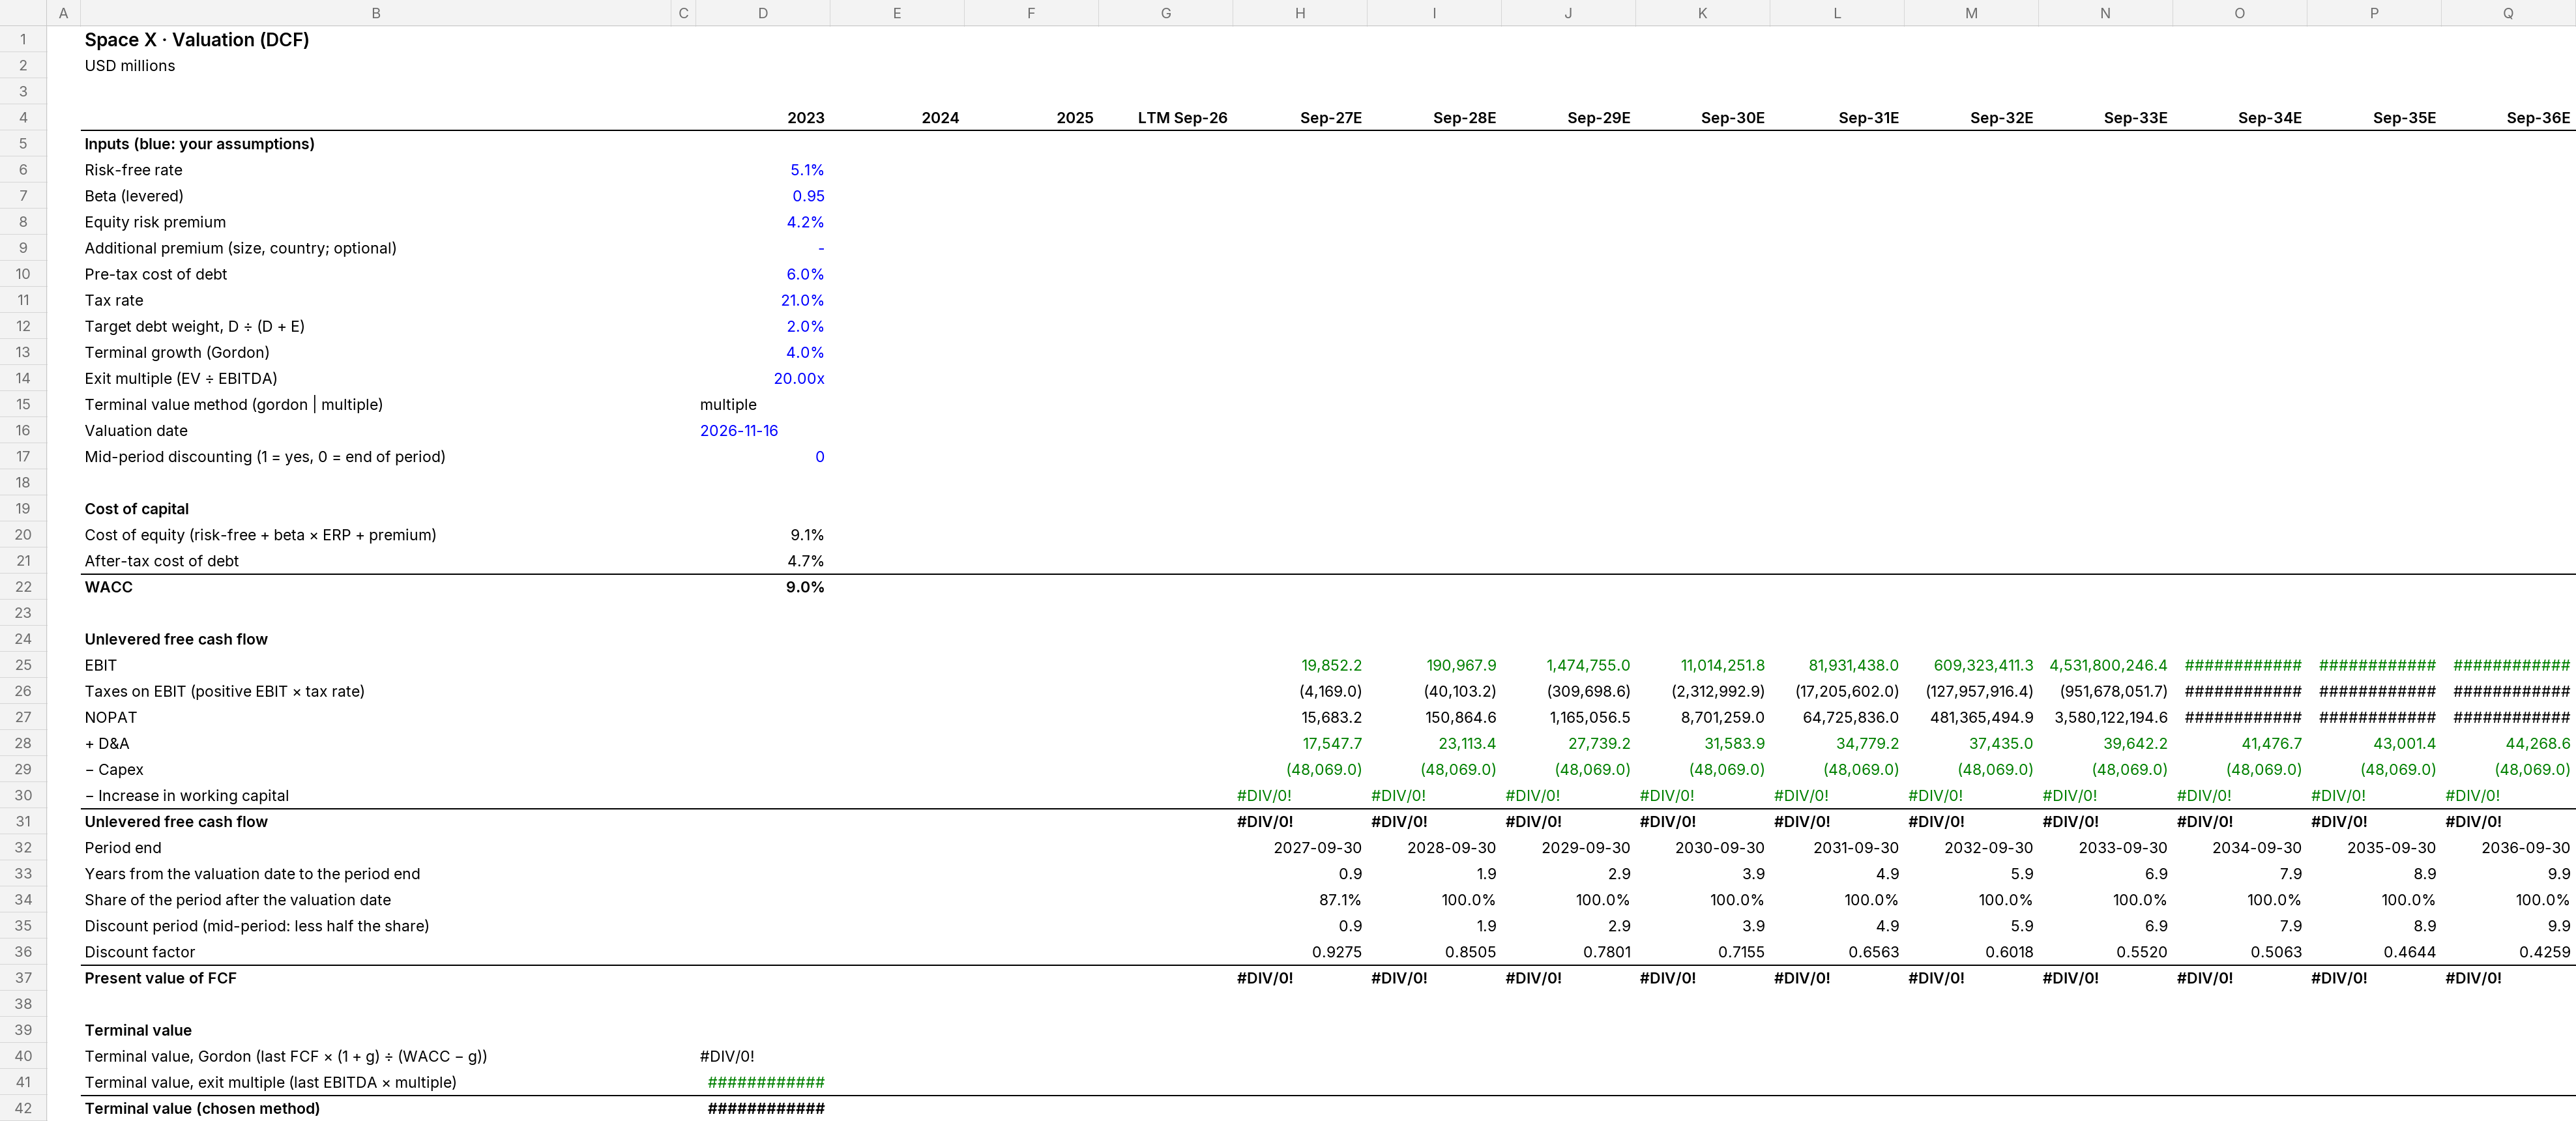
Space X summary financials
USD millions · historical and projected years 2023–2036. From the model's Summary sheet; every projected figure is a formula in the Excel.
| Historical | Projected | ||||||||||||||
|---|---|---|---|---|---|---|---|---|---|---|---|---|---|---|---|
| USD millions | Unit | 2023 | 2024 | 2025 | 2026 | 2027E | 2028E | 2029E | 2030E | 2031E | 2032E | 2033E | 2034E | 2035E | 2036E |
| Income statement | |||||||||||||||
| Revenue | 10,387.0 | 14,015.0 | 18,674.0 | 32,043.0 | 104,884.0 | 600,368.1 | 4,213,585.1 | 30,976,869.8 | 229,865,526.0 | 1,708,887,589.4 | 12,709,062,274.6 | 94,524,798,377.4 | 703,047,271,242.6 | 5,229,071,923,446.6 | |
| Revenue growth | 34.9% | 33.2% | 71.6% | 227.3% | 472.4% | 601.8% | 635.2% | 642.1% | 643.4% | 643.7% | 643.8% | 643.8% | 643.8% | ||
| Gross profit | 4,277.0 | 6,019.0 | 9,223.0 | 18,180.0 | 77,497.0 | 520,933.3 | 3,790,563.3 | 28,039,301.1 | 208,266,730.5 | 1,548,536,947.4 | 11,516,767,188.3 | 85,657,249,366.4 | 637,093,350,721.8 | 4,738,525,107,593.6 | |
| Gross margin | 41.2% | 42.9% | 49.4% | 56.7% | 73.9% | 86.8% | 90.0% | 90.5% | 90.6% | 90.6% | 90.6% | 90.6% | 90.6% | 90.6% | |
| EBITDA | 3,142.0 | 4,566.0 | 4,637.0 | 11,426.0 | 37,399.9 | 214,081.3 | 1,502,494.2 | 11,045,835.7 | 81,966,217.3 | 609,360,846.2 | 4,531,839,888.6 | 33,705,968,425.6 | 250,694,944,955.8 | 1,864,599,937,499.7 | |
| EBITDA margin | 30.2% | 32.6% | 24.8% | 35.7% | 35.7% | 35.7% | 35.7% | 35.7% | 35.7% | 35.7% | 35.7% | 35.7% | 35.7% | 35.7% | |
| EBIT | 507.0 | 742.0 | (2,064.0) | 575.0 | 19,852.2 | 190,967.9 | 1,474,755.0 | 11,014,251.8 | 81,931,438.0 | 609,323,411.3 | 4,531,800,246.4 | 33,705,926,948.9 | 250,694,901,954.4 | 1,864,599,893,231.1 | |
| EBIT margin | 4.9% | 5.3% | (11.1%) | 1.8% | 18.9% | 31.8% | 35.0% | 35.6% | 35.6% | 35.7% | 35.7% | 35.7% | 35.7% | 35.7% | |
| Pre-tax income | (4,991.0) | 242.0 | (4,219.0) | (3,117.0) | #DIV/0! | #DIV/0! | #DIV/0! | #DIV/0! | #DIV/0! | #DIV/0! | #DIV/0! | #DIV/0! | #DIV/0! | #DIV/0! | |
| Income taxes | (363.0) | (549.0) | 718.0 | (357.0) | #DIV/0! | #DIV/0! | #DIV/0! | #DIV/0! | #DIV/0! | #DIV/0! | #DIV/0! | #DIV/0! | #DIV/0! | #DIV/0! | |
| Effective tax rate | 7.3% | (226.9%) | (17.0%) | 11.5% | |||||||||||
| Net income | (4,628.0) | 791.0 | (4,937.0) | (2,760.0) | #DIV/0! | #DIV/0! | #DIV/0! | #DIV/0! | #DIV/0! | #DIV/0! | #DIV/0! | #DIV/0! | #DIV/0! | #DIV/0! | |
| Net income to shareholders | (616.0) | 1,067.0 | (4,412.0) | (985.0) | #DIV/0! | #DIV/0! | #DIV/0! | #DIV/0! | #DIV/0! | #DIV/0! | #DIV/0! | #DIV/0! | #DIV/0! | #DIV/0! | |
| Net margin | (5.9%) | 7.6% | (23.6%) | (3.1%) | |||||||||||
| Earnings per share | (0.22) | 0.11 | (1.51) | (0.14) | |||||||||||
| Cash flow | |||||||||||||||
| Cash flow from operations | 7,389.0 | #DIV/0! | #DIV/0! | #DIV/0! | #DIV/0! | #DIV/0! | #DIV/0! | #DIV/0! | #DIV/0! | #DIV/0! | #DIV/0! | ||||
| Capex | 48,069.0 | 48,069.0 | 48,069.0 | 48,069.0 | 48,069.0 | 48,069.0 | 48,069.0 | 48,069.0 | 48,069.0 | 48,069.0 | 48,069.0 | ||||
| Unlevered free cash flow | (32,055.9) | #DIV/0! | #DIV/0! | #DIV/0! | #DIV/0! | #DIV/0! | #DIV/0! | #DIV/0! | #DIV/0! | #DIV/0! | #DIV/0! | ||||
| FCF margin | (100.0%) | ||||||||||||||
| Balance sheet | |||||||||||||||
| Cash and cash equivalents | 24,747.0 | 51,294.0 | #DIV/0! | #DIV/0! | #DIV/0! | #DIV/0! | #DIV/0! | #DIV/0! | #DIV/0! | #DIV/0! | #DIV/0! | #DIV/0! | |||
| Financial debt | 22,896.0 | 38,844.0 | 39,827.0 | 39,827.0 | 39,827.0 | 39,827.0 | 39,827.0 | 39,827.0 | 39,827.0 | 39,827.0 | 39,827.0 | 39,827.0 | |||
| Net debt (financial debt − cash) | (1,851.0) | (12,450.0) | #DIV/0! | #DIV/0! | #DIV/0! | #DIV/0! | #DIV/0! | #DIV/0! | #DIV/0! | #DIV/0! | #DIV/0! | #DIV/0! | |||
| Total equity | 41,325.0 | 176,768.0 | #DIV/0! | #DIV/0! | #DIV/0! | #DIV/0! | #DIV/0! | #DIV/0! | #DIV/0! | #DIV/0! | #DIV/0! | #DIV/0! | |||
| Balance check (assets − liabilities − equity) | - | - | #DIV/0! | #DIV/0! | #DIV/0! | #DIV/0! | #DIV/0! | #DIV/0! | #DIV/0! | #DIV/0! | #DIV/0! | #DIV/0! | |||
| Key ratios | |||||||||||||||
| EBITDA margin | 30.2% | 32.6% | 24.8% | 35.7% | 35.7% | 35.7% | 35.7% | 35.7% | 35.7% | 35.7% | 35.7% | 35.7% | 35.7% | 35.7% | |
| ROIC (EBIT × (1 − t) ÷ average invested capital) | (5.2%) | 0.5% | |||||||||||||
| FCF margin | (100.0%) | ||||||||||||||
| Net debt ÷ EBITDA | (0.40x) | (1.09x) | |||||||||||||
| EBITDA ÷ interest | 1.86x | 2.89x | 2.38x | 4.50x | 15.18x | 86.91x | 609.96x | 4484.21x | 33275.31x | 247378.41x | 1839762.71x | 13683401.29x | 101773059.57x | 756959980.01x | |
| Minimum DSCR over the projection | - | ||||||||||||||
How revenue is built
Skale reads the documents to decide how each revenue stream is projected, and explains why.
Launch Services revenue is recognised per customer launch at a point in time, so it is customer launches × revenue per launch. Customer launches are reported for three full years and the interim period.
Launch & Development is revenue on long government contracts recognised on cost-to-cost progress. No operational driver is reported for it, so growth on prior revenue is the best supported build.
Consumer revenue is recurring subscription revenue. It is modelled as ending subscribers × revenue per subscriber, the latter derived from reported revenue and reported subscribers. This is the model the company itself uses in its MD&A (subscriber growth × ARPU decline).
No operational driver for enterprise and government is reported for two years, so growth on revenue stays. A data request is raised for a fleet-based or subscriber-based build.
MAU is reported at only two nearby dates and cannot give a yearly history. Advertising stays on growth, and a data request is raised for users × ARPU.
Most SI Solutions & Infrastructure revenue now comes from cloud services that monetise installed compute. It is modelled as nameplate compute × revenue per GW, with revenue per GW derived from reported revenue and reported GW.
Build this for your company
Upload your financial statements; Skale builds the model, and you review the assumptions.
Get startedNew to financial models? What is a financial model?