Petrobras financial model
This Excel model of Petrobras has three statements (income statement, balance sheet and cash flow), five projected years from Jun-27E to Jun-31E, and a DCF valuation. Skale built it automatically from 4 published financial documents. For LTM Jun-26, revenue was $104.2 billion (up 16.9% vs 2025), net income to shareholders was $25.6 billion, and net debt was $19.4 billion. Projected revenue reaches $272.5 billion by Jun-31E, and the DCF enterprise value is $834.5 billion under the model's assumptions.
Preview the Excel
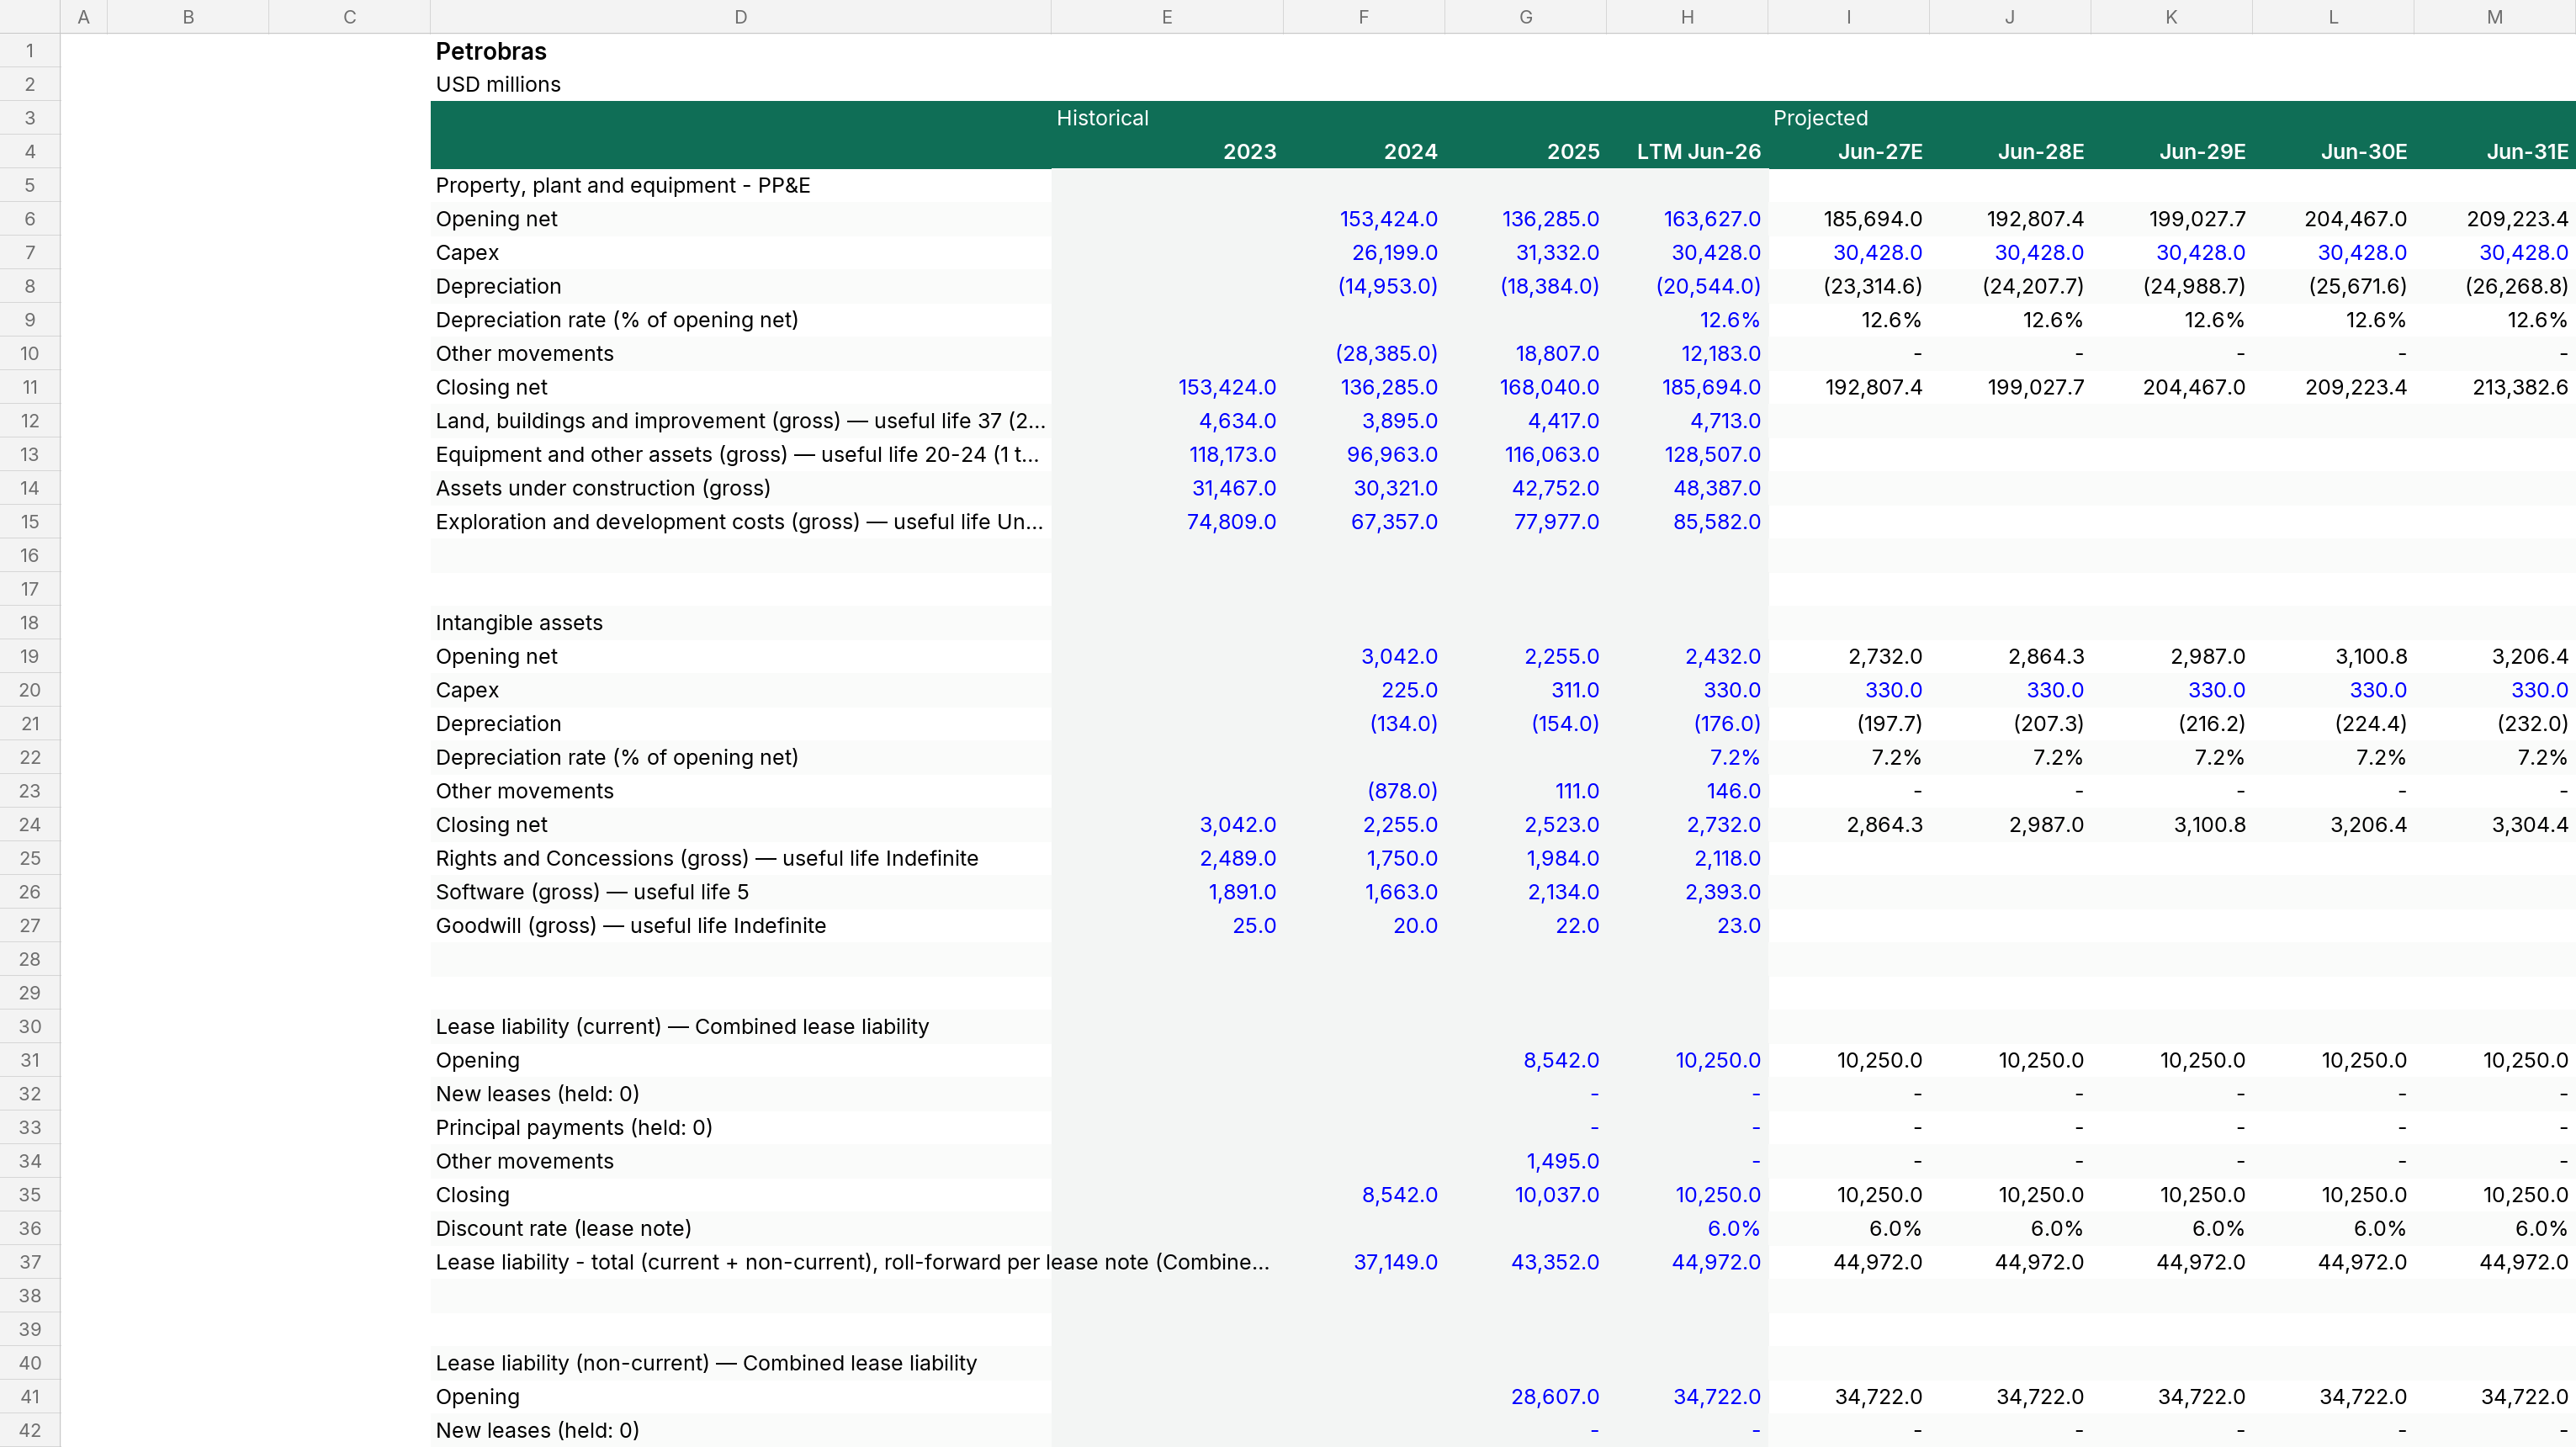
The first rows of each sheet, as they open in Excel.
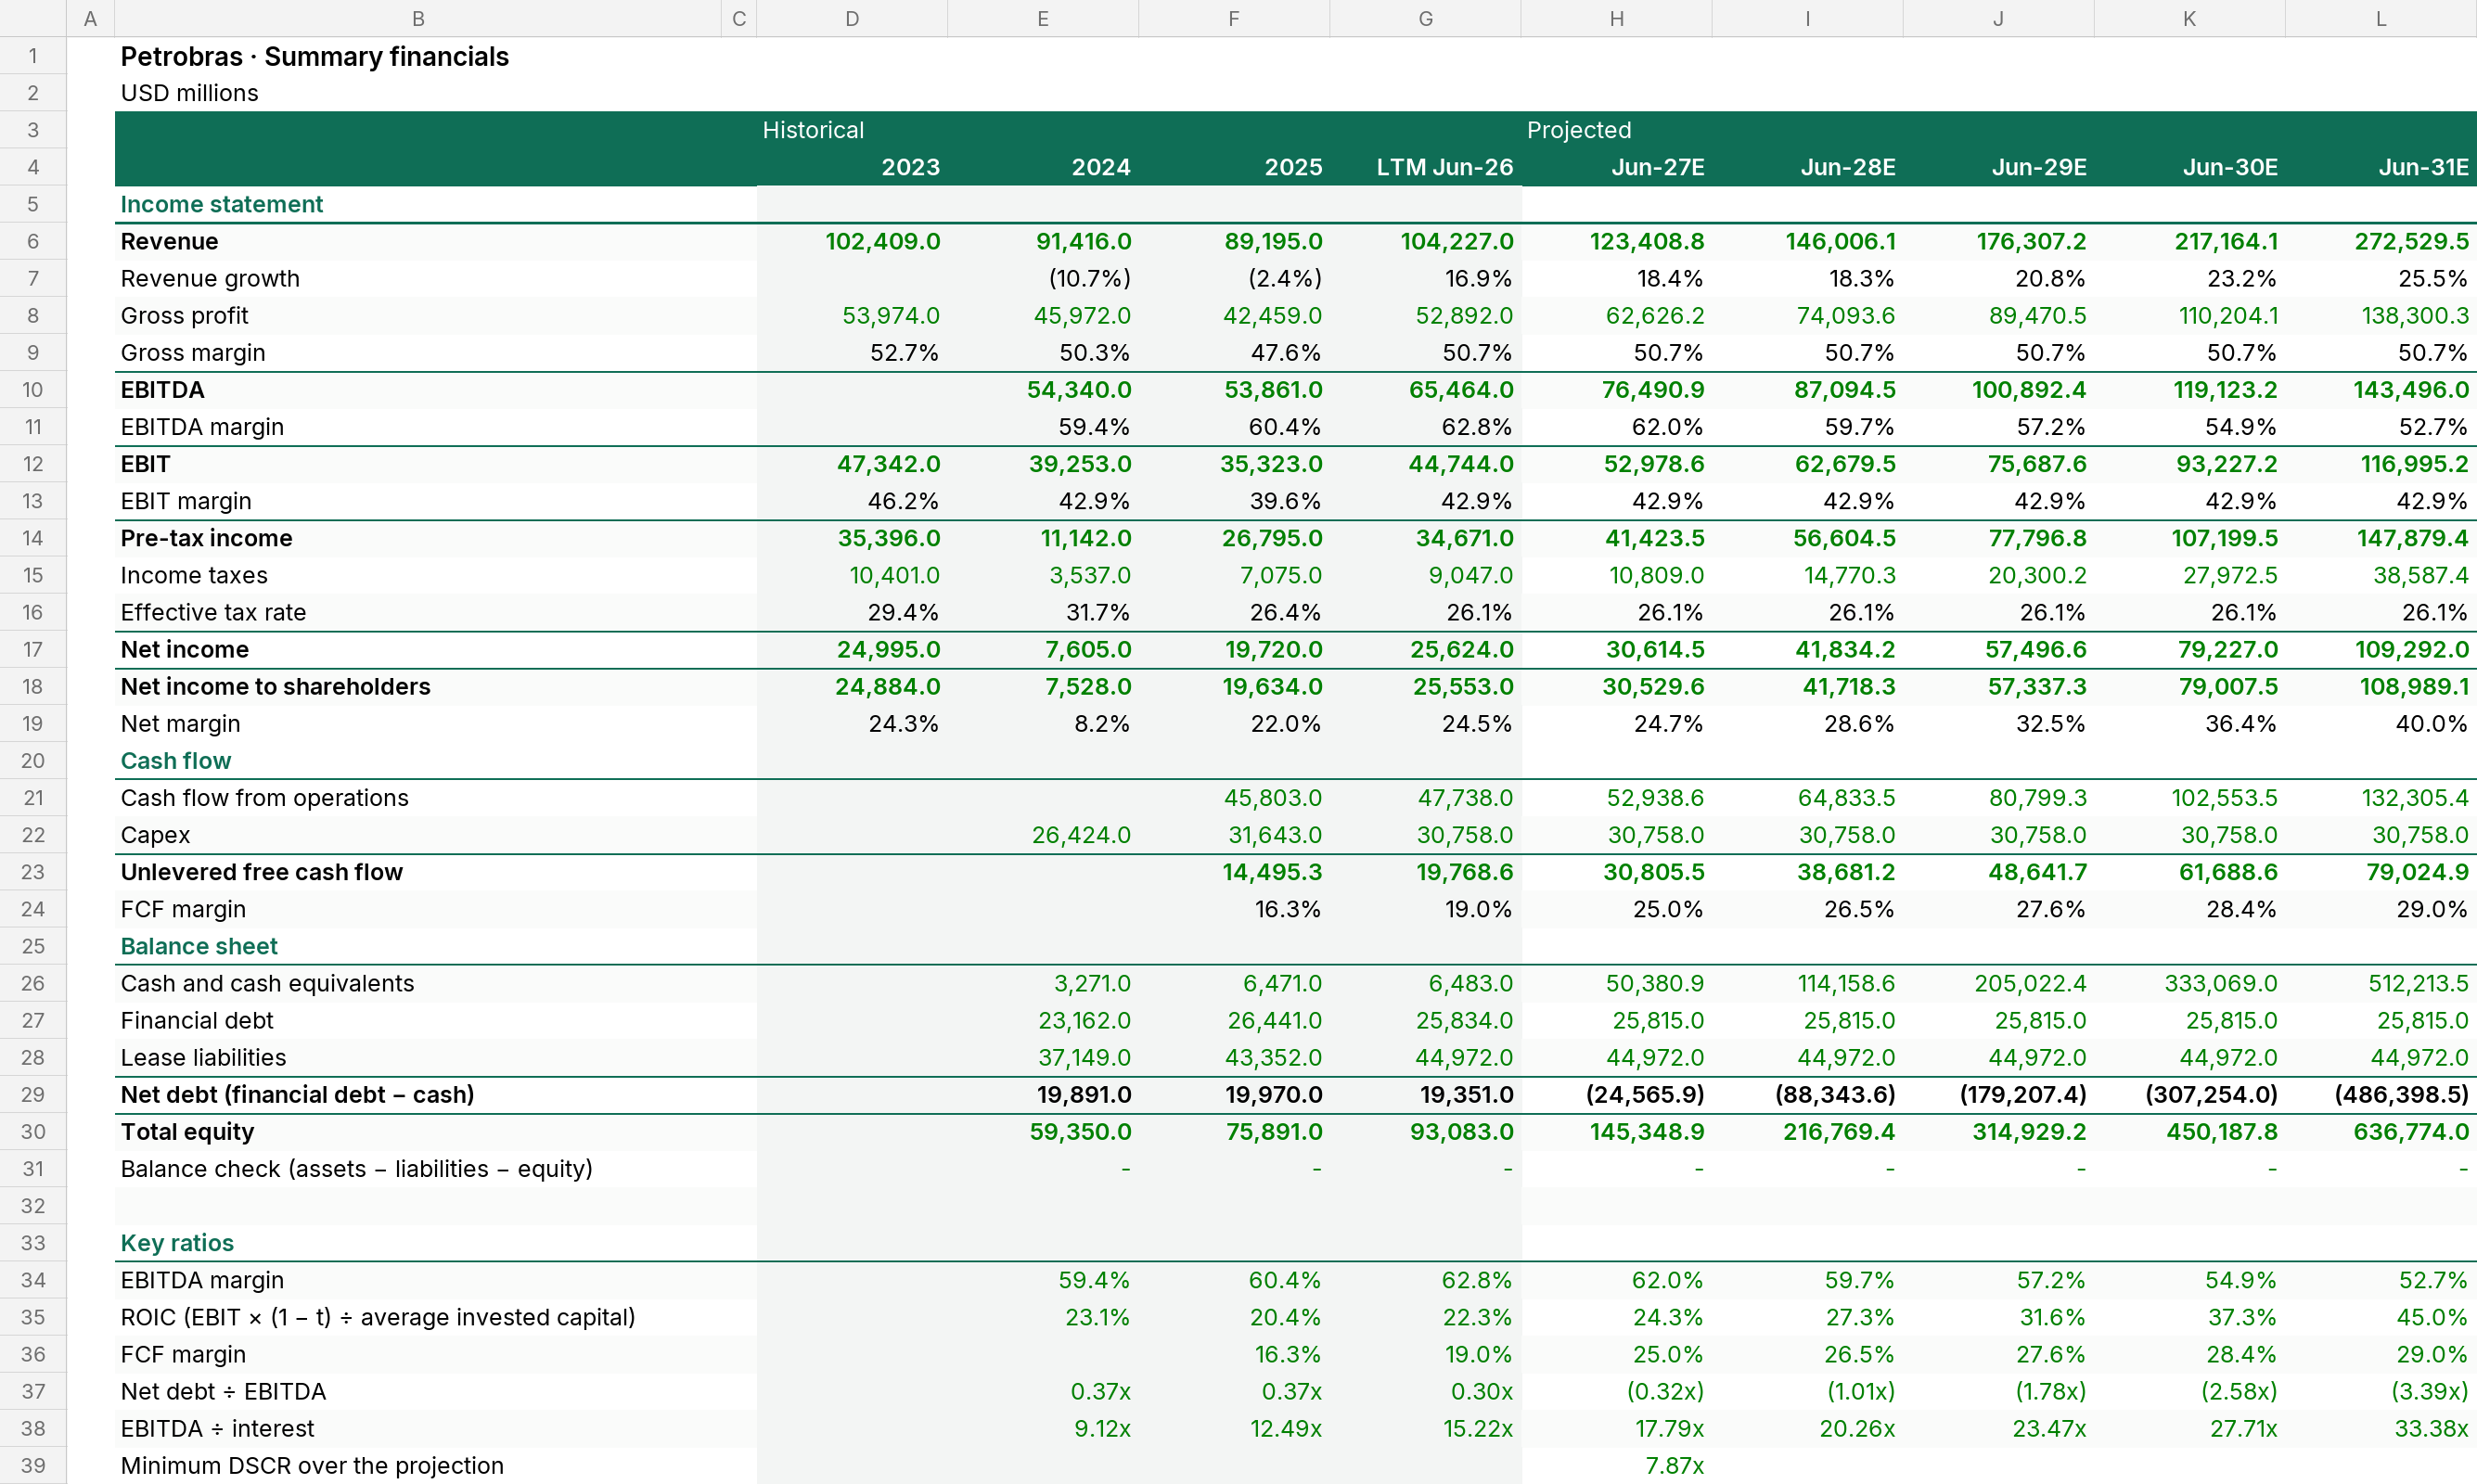
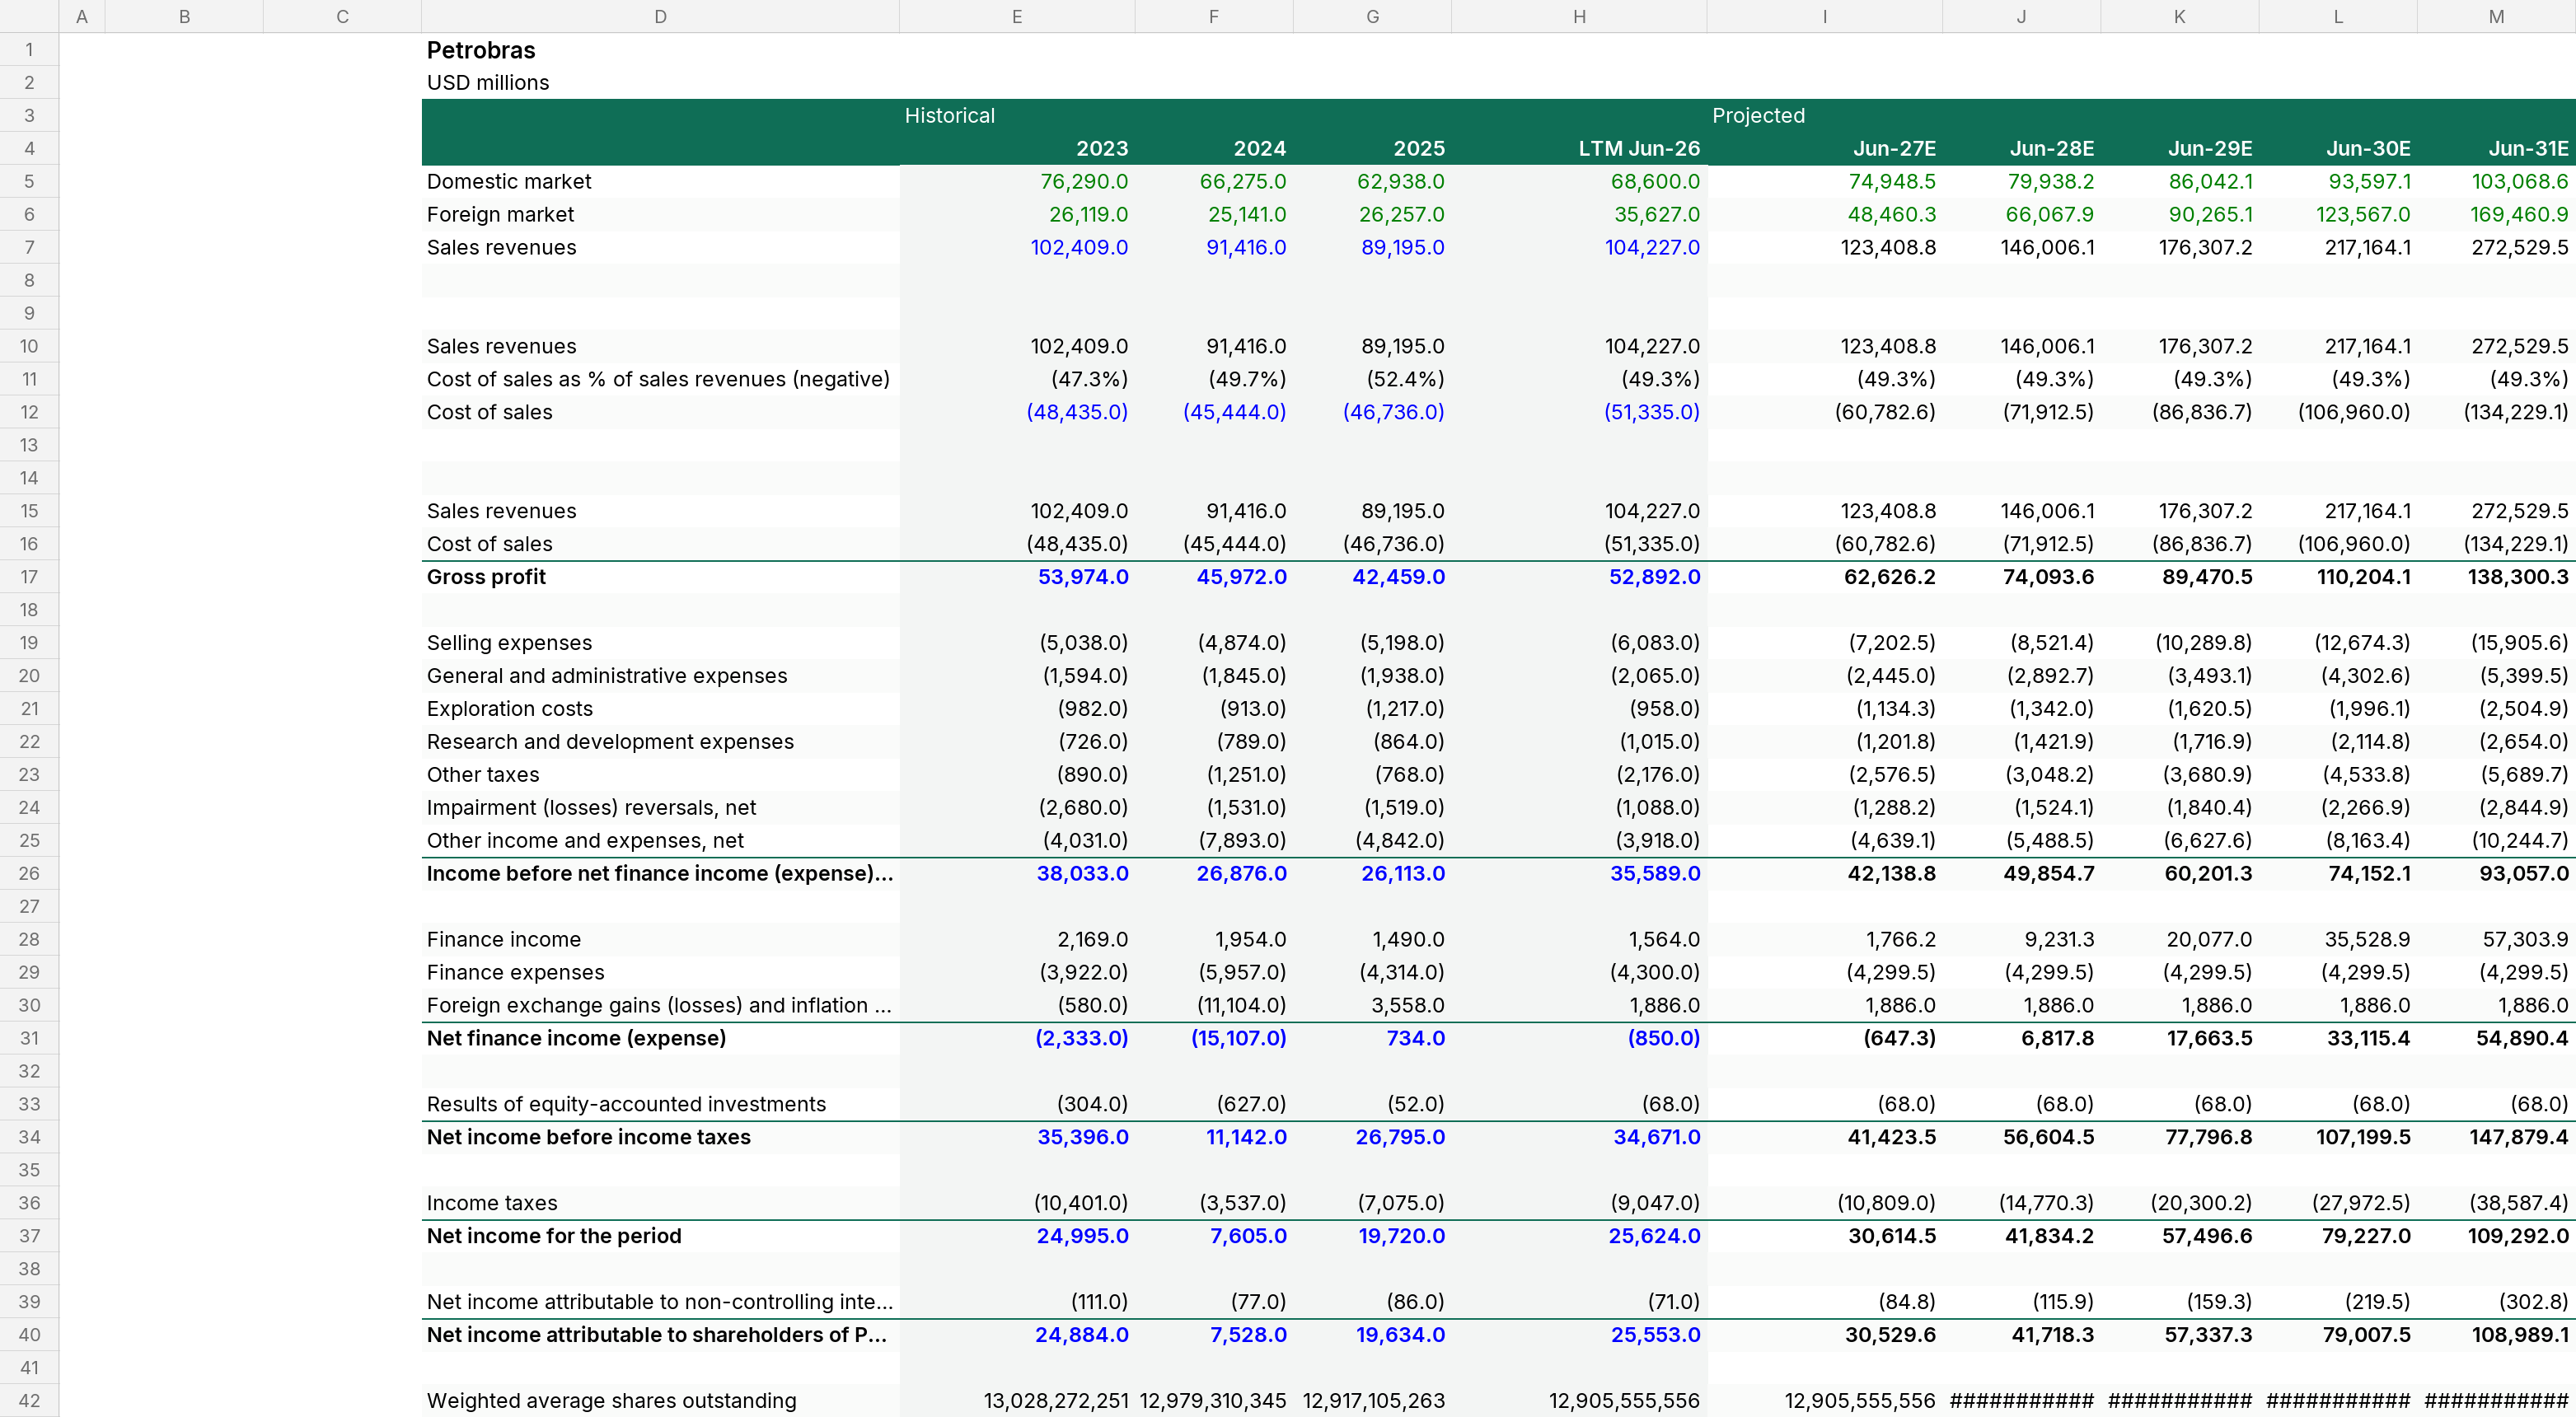
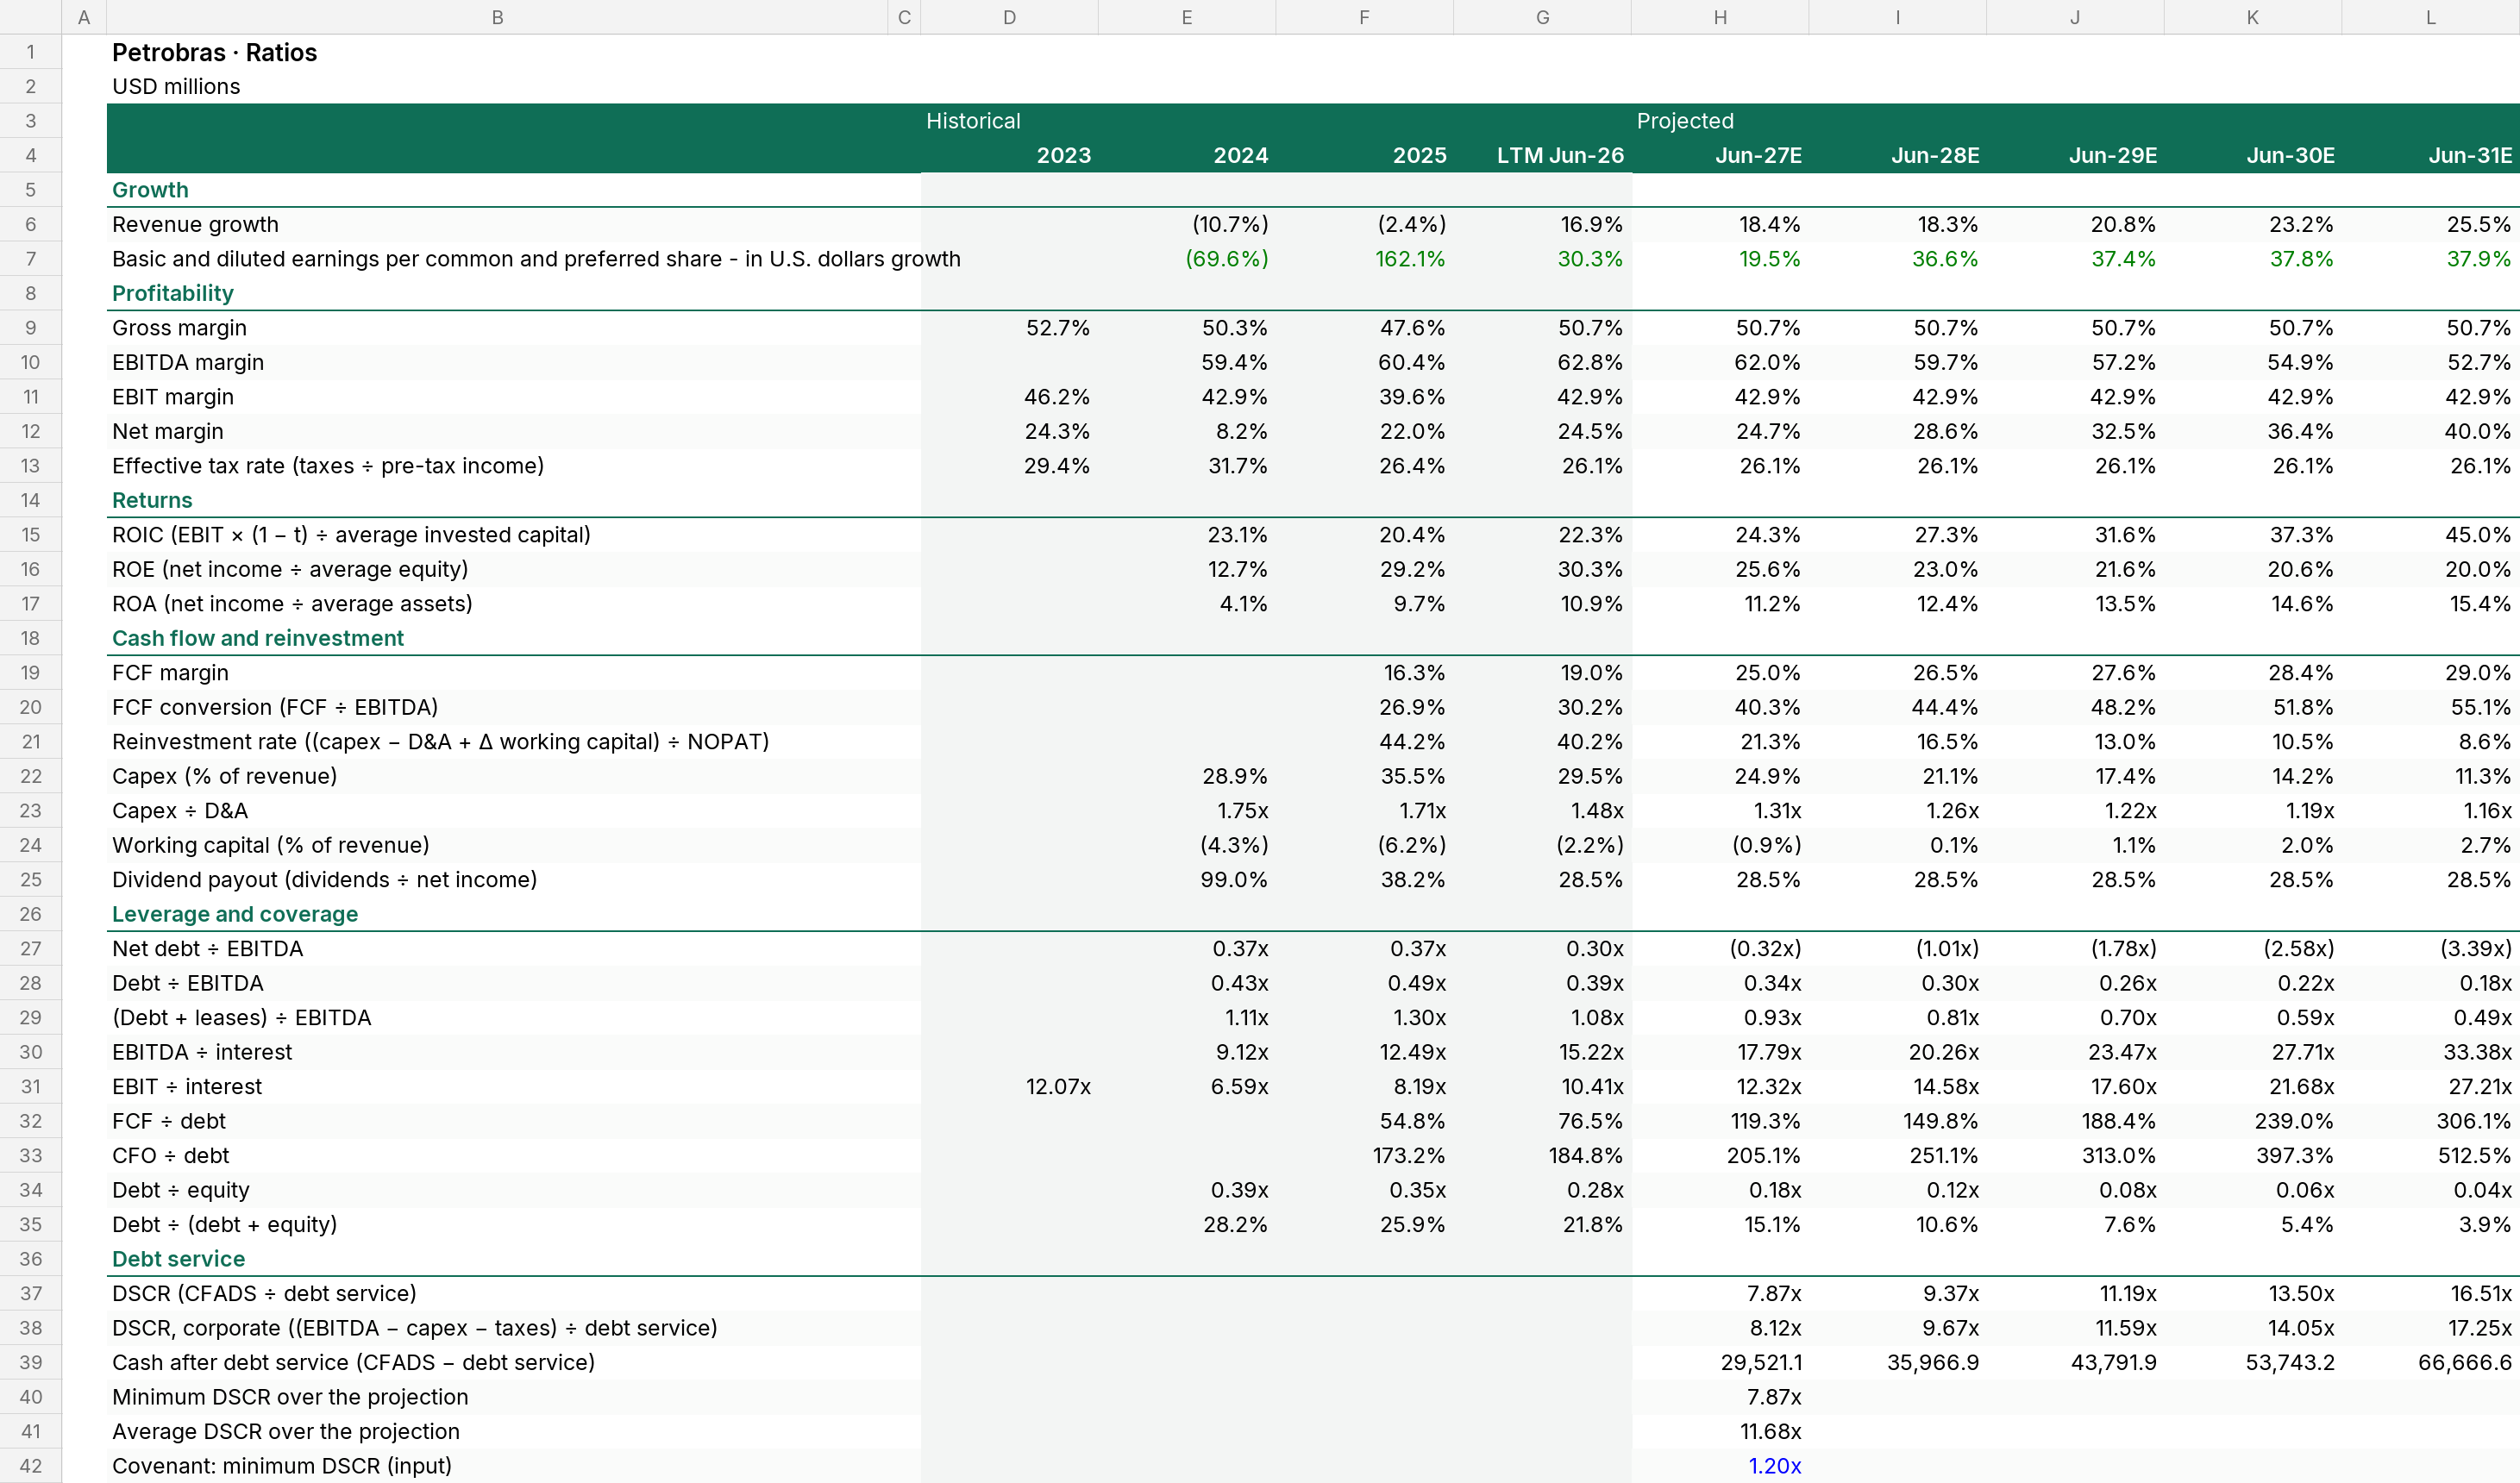
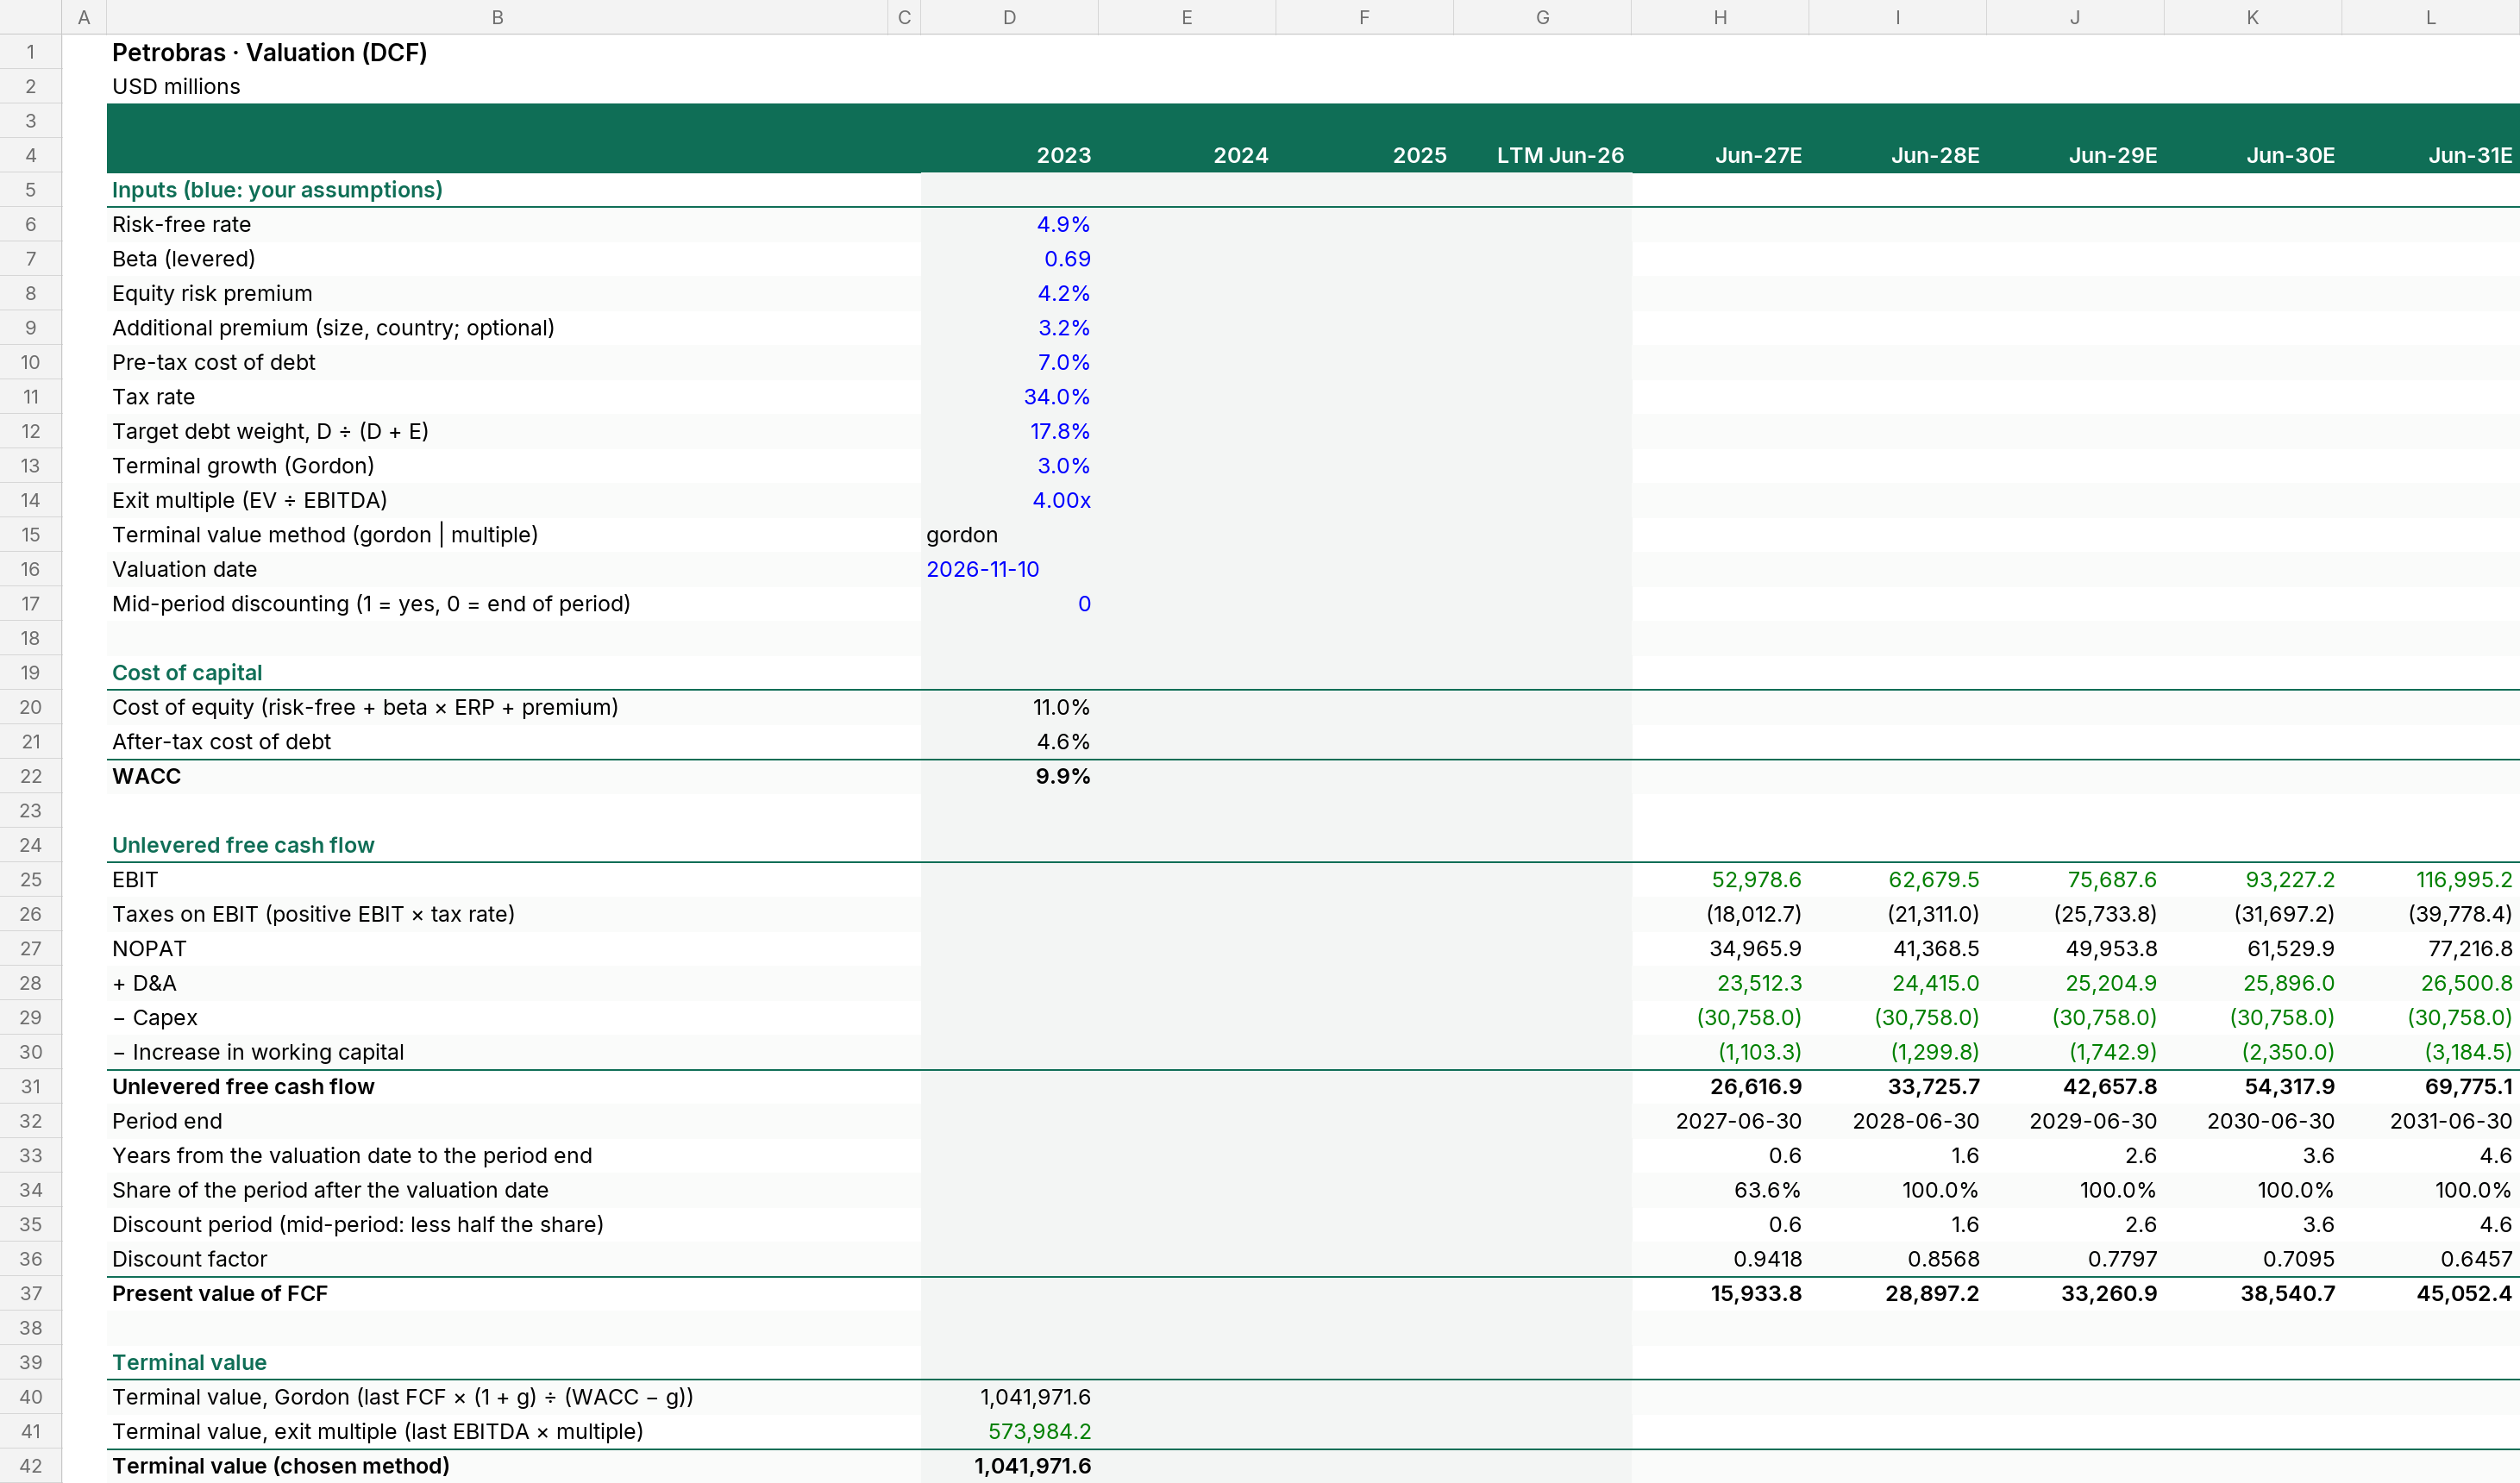
Petrobras summary financials
USD millions · historical and projected years 2023–2031. From the model's Summary sheet; every projected figure is a formula in the Excel.
| Historical | Projected | |||||||||
|---|---|---|---|---|---|---|---|---|---|---|
| USD millions | Unit | 2023 | 2024 | 2025 | 2026 | 2027E | 2028E | 2029E | 2030E | 2031E |
| Income statement | ||||||||||
| Revenue | 102,409.0 | 91,416.0 | 89,195.0 | 104,227.0 | 123,408.8 | 146,006.1 | 176,307.2 | 217,164.1 | 272,529.5 | |
| Revenue growth | (10.7%) | (2.4%) | 16.9% | 18.4% | 18.3% | 20.8% | 23.2% | 25.5% | ||
| Gross profit | 53,974.0 | 45,972.0 | 42,459.0 | 52,892.0 | 62,626.2 | 74,093.6 | 89,470.5 | 110,204.1 | 138,300.3 | |
| Gross margin | 52.7% | 50.3% | 47.6% | 50.7% | 50.7% | 50.7% | 50.7% | 50.7% | 50.7% | |
| EBITDA | 54,340.0 | 53,861.0 | 65,464.0 | 76,490.9 | 87,094.5 | 100,892.4 | 119,123.2 | 143,496.0 | ||
| EBITDA margin | 59.4% | 60.4% | 62.8% | 62.0% | 59.7% | 57.2% | 54.9% | 52.7% | ||
| EBIT | 47,342.0 | 39,253.0 | 35,323.0 | 44,744.0 | 52,978.6 | 62,679.5 | 75,687.6 | 93,227.2 | 116,995.2 | |
| EBIT margin | 46.2% | 42.9% | 39.6% | 42.9% | 42.9% | 42.9% | 42.9% | 42.9% | 42.9% | |
| Pre-tax income | 35,396.0 | 11,142.0 | 26,795.0 | 34,671.0 | 41,423.5 | 56,604.5 | 77,796.8 | 107,199.5 | 147,879.4 | |
| Income taxes | 10,401.0 | 3,537.0 | 7,075.0 | 9,047.0 | 10,809.0 | 14,770.3 | 20,300.2 | 27,972.5 | 38,587.4 | |
| Effective tax rate | 29.4% | 31.7% | 26.4% | 26.1% | 26.1% | 26.1% | 26.1% | 26.1% | 26.1% | |
| Net income | 24,995.0 | 7,605.0 | 19,720.0 | 25,624.0 | 30,614.5 | 41,834.2 | 57,496.6 | 79,227.0 | 109,292.0 | |
| Net income to shareholders | 24,884.0 | 7,528.0 | 19,634.0 | 25,553.0 | 30,529.6 | 41,718.3 | 57,337.3 | 79,007.5 | 108,989.1 | |
| Net margin | 24.3% | 8.2% | 22.0% | 24.5% | 24.7% | 28.6% | 32.5% | 36.4% | 40.0% | |
| Cash flow | ||||||||||
| Cash flow from operations | 45,803.0 | 47,738.0 | 52,938.6 | 64,833.5 | 80,799.3 | 102,553.5 | 132,305.4 | |||
| Capex | 26,424.0 | 31,643.0 | 30,758.0 | 30,758.0 | 30,758.0 | 30,758.0 | 30,758.0 | 30,758.0 | ||
| Unlevered free cash flow | 14,495.3 | 19,768.6 | 30,805.5 | 38,681.2 | 48,641.7 | 61,688.6 | 79,024.9 | |||
| FCF margin | 16.3% | 19.0% | 25.0% | 26.5% | 27.6% | 28.4% | 29.0% | |||
| Balance sheet | ||||||||||
| Cash and cash equivalents | 3,271.0 | 6,471.0 | 6,483.0 | 50,380.9 | 114,158.6 | 205,022.4 | 333,069.0 | 512,213.5 | ||
| Financial debt | 23,162.0 | 26,441.0 | 25,834.0 | 25,815.0 | 25,815.0 | 25,815.0 | 25,815.0 | 25,815.0 | ||
| Lease liabilities | 37,149.0 | 43,352.0 | 44,972.0 | 44,972.0 | 44,972.0 | 44,972.0 | 44,972.0 | 44,972.0 | ||
| Net debt (financial debt − cash) | 19,891.0 | 19,970.0 | 19,351.0 | (24,565.9) | (88,343.6) | (179,207.4) | (307,254.0) | (486,398.5) | ||
| Total equity | 59,350.0 | 75,891.0 | 93,083.0 | 145,348.9 | 216,769.4 | 314,929.2 | 450,187.8 | 636,774.0 | ||
| Balance check (assets − liabilities − equity) | - | - | - | - | - | - | - | - | ||
| Key ratios | ||||||||||
| EBITDA margin | 59.4% | 60.4% | 62.8% | 62.0% | 59.7% | 57.2% | 54.9% | 52.7% | ||
| ROIC (EBIT × (1 − t) ÷ average invested capital) | 23.1% | 20.4% | 22.3% | 24.3% | 27.3% | 31.6% | 37.3% | 45.0% | ||
| FCF margin | 16.3% | 19.0% | 25.0% | 26.5% | 27.6% | 28.4% | 29.0% | |||
| Net debt ÷ EBITDA | 0.37x | 0.37x | 0.30x | (0.32x) | (1.01x) | (1.78x) | (2.58x) | (3.39x) | ||
| EBITDA ÷ interest | 9.12x | 12.49x | 15.22x | 17.79x | 20.26x | 23.47x | 27.71x | 33.38x | ||
| Minimum DSCR over the projection | 7.87x | |||||||||
How revenue is built
Skale reads the documents to decide how each revenue stream is projected, and explains why.
Petrobras reports domestic diesel sales volumes for two full years and the interim period, so revenue is built as volume x average price.
Reported domestic gasoline volumes for at least two years support volume x price.
Reported domestic LPG volumes for at least two years support volume x price.
Reported jet fuel volumes for at least two years support volume x price.
Reported naphtha volumes for at least two years support volume x price.
Reported fuel oil volumes for at least two years support volume x price.
Reported volumes for other oil products for at least two years support volume x price.
Reported natural gas sales volumes for at least two years support volume x price.
Reported domestic crude oil sales volumes for at least two years support volume x price.
A reported volume exists for two years, so volume x price is used.
Reported electricity sales in average MW for at least two years support volume x price.
Reported crude export volumes for at least two years support volume x price. The price follows Brent.
Reported fuel oil export volumes for at least two years support volume x price.
Reported other oil product export volumes for at least two years support volume x price.
Reported volumes for sales abroad (trading and foreign operations) for at least two years support volume x price.
The subsidy started in March 2026 and has no two-year driver history, so the current build is kept.
The subsidy started in 2026 and has no history, so the current build is kept.
The subsidy started in 2026 and has no history, so the current build is kept.
Breakage has no operational driver in the documents, so growth is the best supported build.
Services and agency revenue has no operational driver in the documents, so growth is the best supported build.
Build this for your company
Upload your financial statements; Skale builds the model, and you review the assumptions.
Get startedNew to financial models? What is a financial model?