Nvidia financial model
This Excel financial model of Nvidia was built automatically by Skale from 4 published documents. It is a 3-statement model (income statement, balance sheet, cash flow) with 10 projected years, Jul-28E to Jul-37E, and a DCF valuation. For the LTM period to Jul-26, revenue was $303.0 billion, net income to shareholders was $170.1 billion and net debt was $10.9 billion. The DCF enterprise value under the model's assumptions is $5.3 trillion.
Preview the Excel
The first rows of each sheet, as they open in Excel.
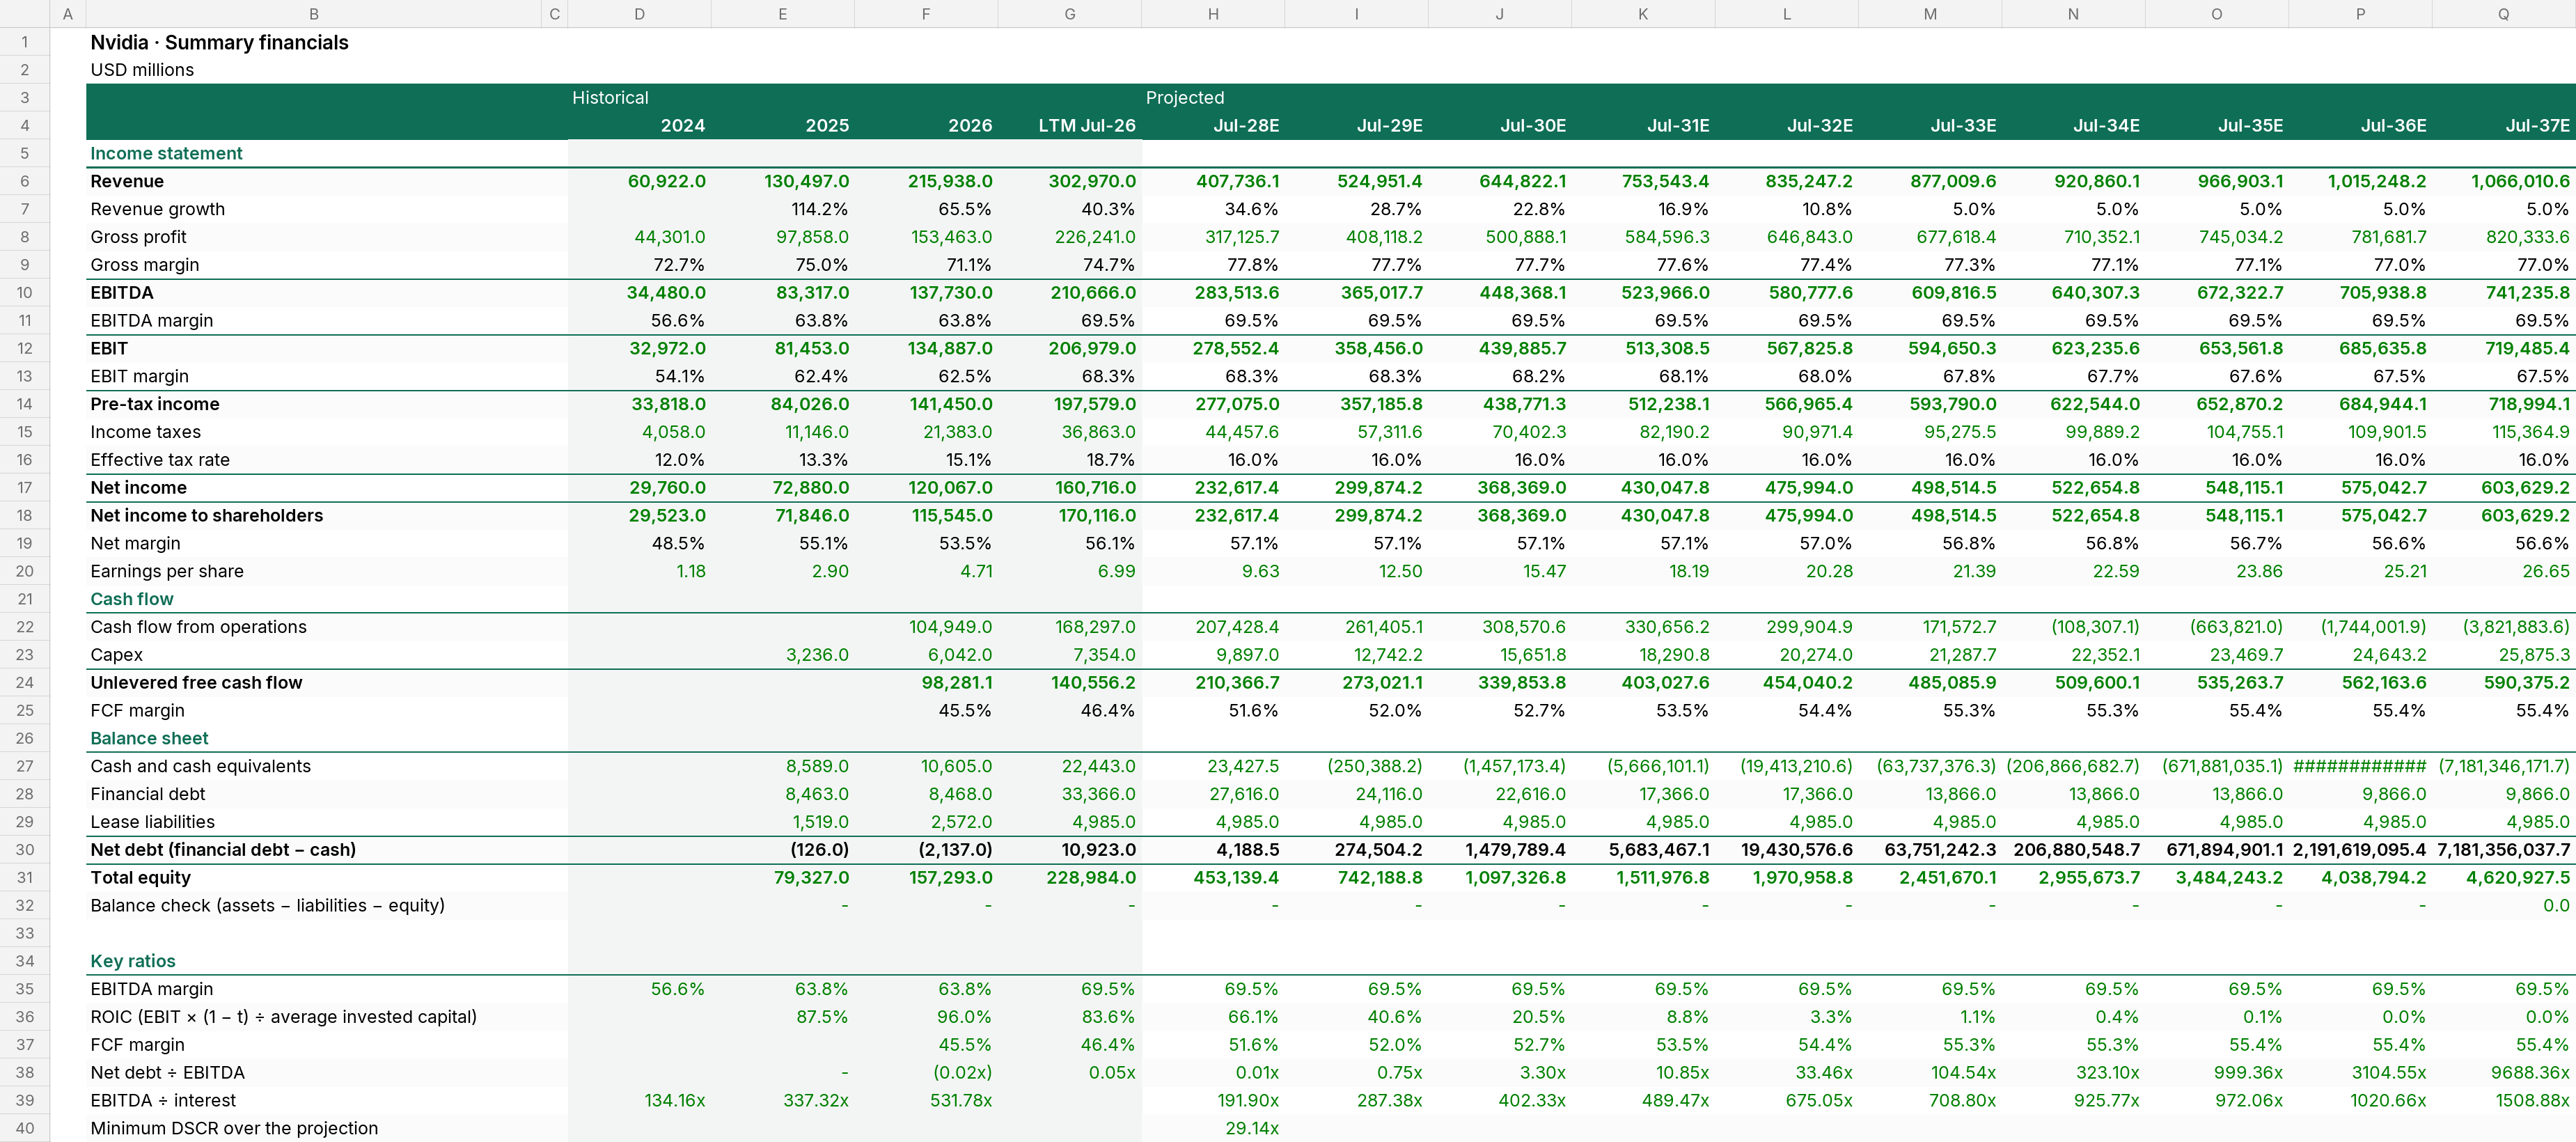
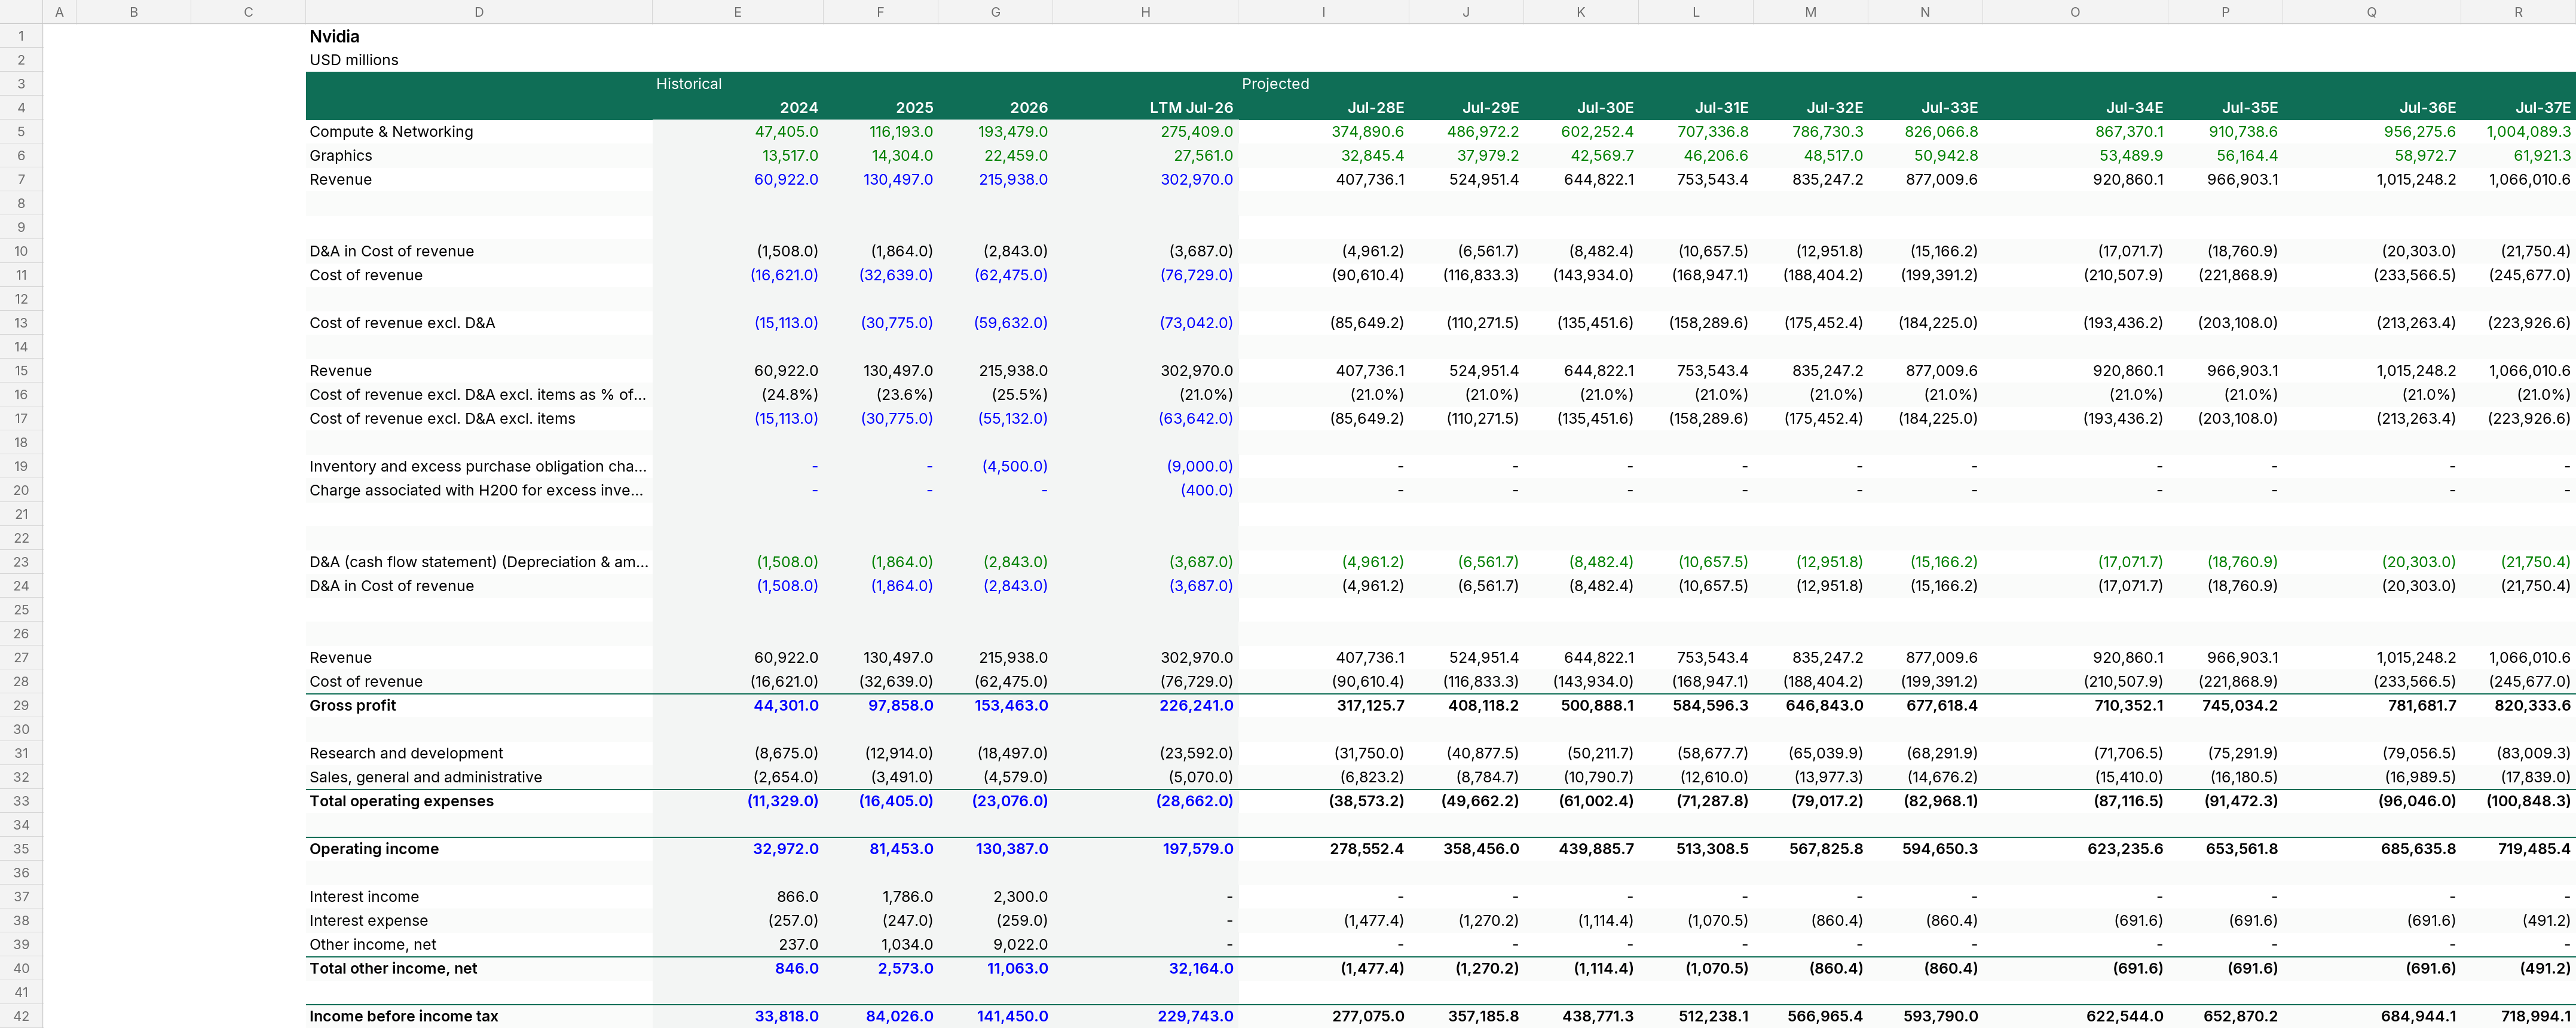
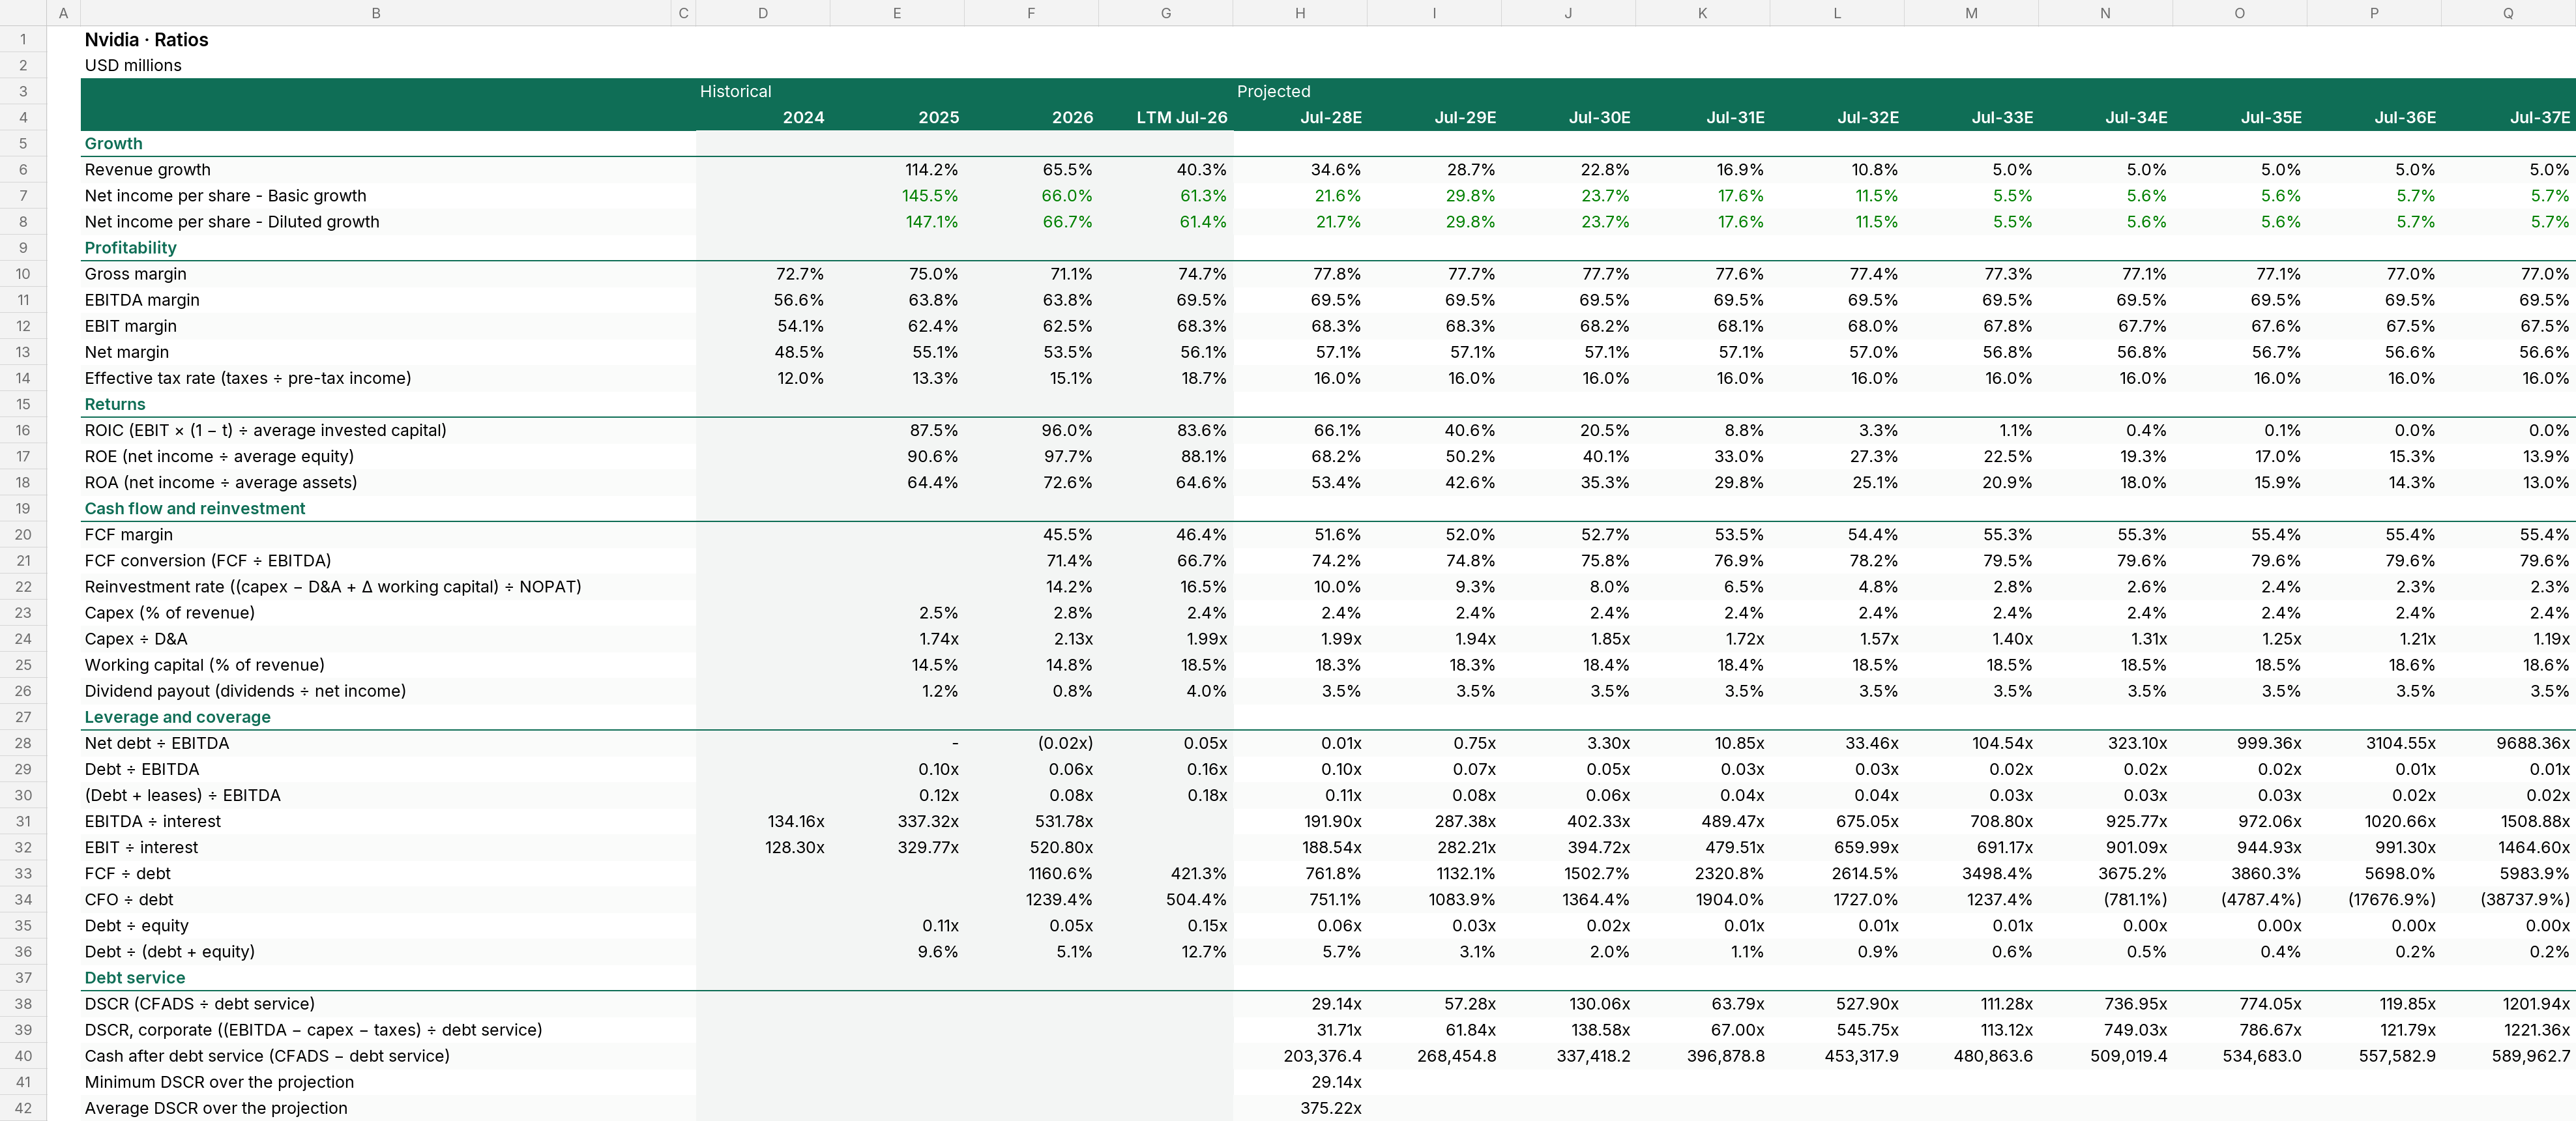
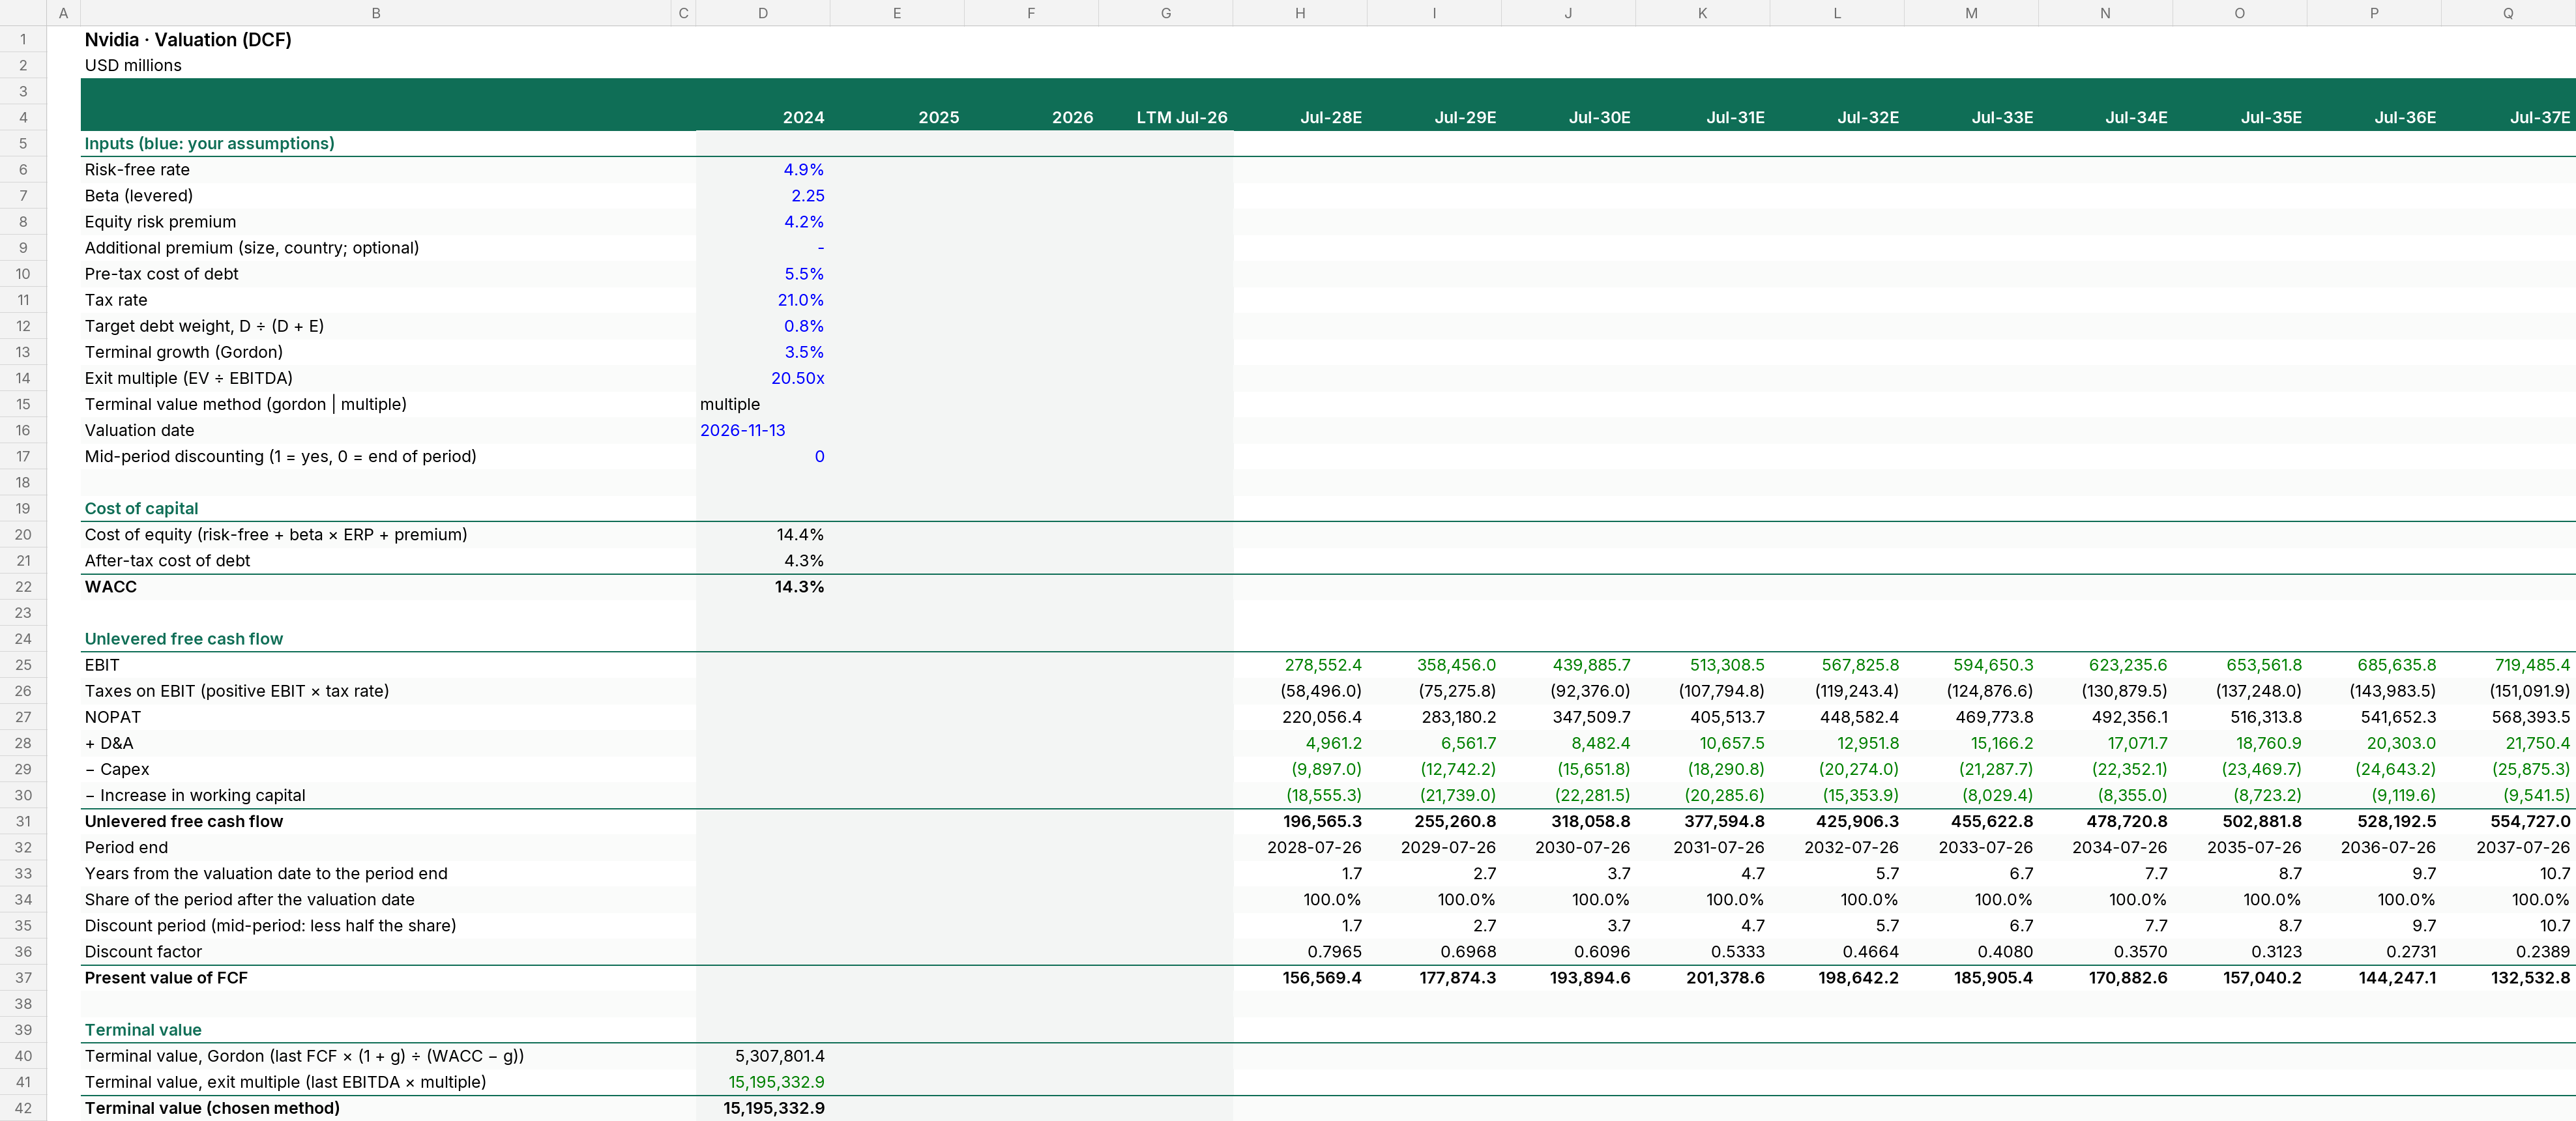
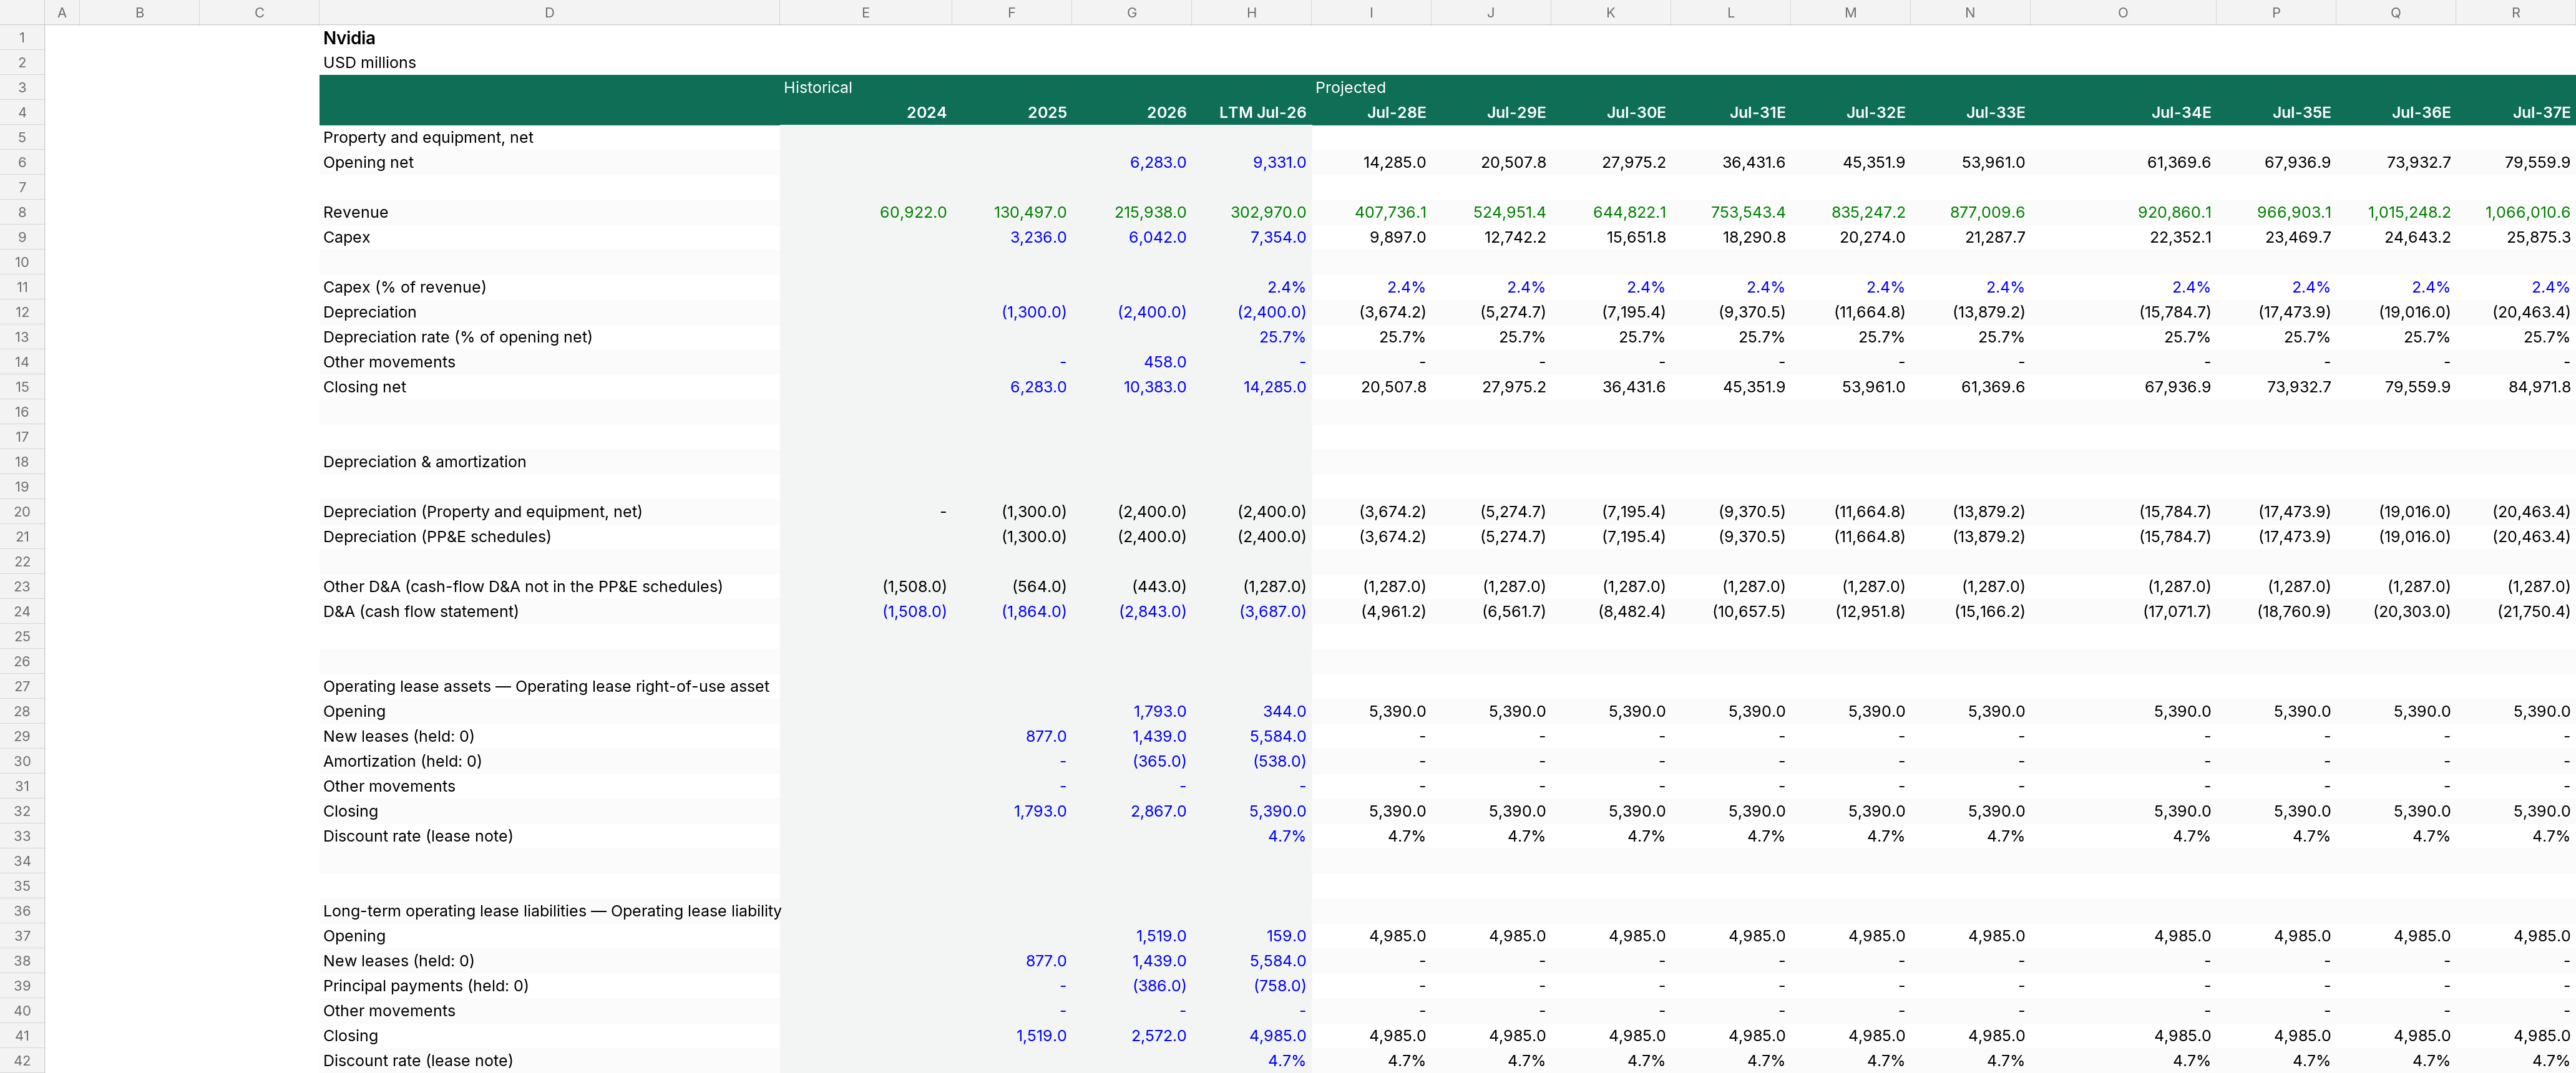
Nvidia summary financials
USD millions · historical and projected years 2024–2037. From the model's Summary sheet; every projected figure is a formula in the Excel.
| Historical | Projected | ||||||||||||||
|---|---|---|---|---|---|---|---|---|---|---|---|---|---|---|---|
| USD millions | Unit | 2024 | 2025 | 2026 | 2027 | 2028E | 2029E | 2030E | 2031E | 2032E | 2033E | 2034E | 2035E | 2036E | 2037E |
| Income statement | |||||||||||||||
| Revenue | 60,922.0 | 130,497.0 | 215,938.0 | 302,970.0 | 407,736.1 | 524,951.4 | 644,822.1 | 753,543.4 | 835,247.2 | 877,009.6 | 920,860.1 | 966,903.1 | 1,015,248.2 | 1,066,010.6 | |
| Revenue growth | 114.2% | 65.5% | 40.3% | 34.6% | 28.7% | 22.8% | 16.9% | 10.8% | 5.0% | 5.0% | 5.0% | 5.0% | 5.0% | ||
| Gross profit | 44,301.0 | 97,858.0 | 153,463.0 | 226,241.0 | 317,125.7 | 408,118.2 | 500,888.1 | 584,596.3 | 646,843.0 | 677,618.4 | 710,352.1 | 745,034.2 | 781,681.7 | 820,333.6 | |
| Gross margin | 72.7% | 75.0% | 71.1% | 74.7% | 77.8% | 77.7% | 77.7% | 77.6% | 77.4% | 77.3% | 77.1% | 77.1% | 77.0% | 77.0% | |
| EBITDA | 34,480.0 | 83,317.0 | 137,730.0 | 210,666.0 | 283,513.6 | 365,017.7 | 448,368.1 | 523,966.0 | 580,777.6 | 609,816.5 | 640,307.3 | 672,322.7 | 705,938.8 | 741,235.8 | |
| EBITDA margin | 56.6% | 63.8% | 63.8% | 69.5% | 69.5% | 69.5% | 69.5% | 69.5% | 69.5% | 69.5% | 69.5% | 69.5% | 69.5% | 69.5% | |
| EBIT | 32,972.0 | 81,453.0 | 134,887.0 | 206,979.0 | 278,552.4 | 358,456.0 | 439,885.7 | 513,308.5 | 567,825.8 | 594,650.3 | 623,235.6 | 653,561.8 | 685,635.8 | 719,485.4 | |
| EBIT margin | 54.1% | 62.4% | 62.5% | 68.3% | 68.3% | 68.3% | 68.2% | 68.1% | 68.0% | 67.8% | 67.7% | 67.6% | 67.5% | 67.5% | |
| Pre-tax income | 33,818.0 | 84,026.0 | 141,450.0 | 197,579.0 | 277,075.0 | 357,185.8 | 438,771.3 | 512,238.1 | 566,965.4 | 593,790.0 | 622,544.0 | 652,870.2 | 684,944.1 | 718,994.1 | |
| Income taxes | 4,058.0 | 11,146.0 | 21,383.0 | 36,863.0 | 44,457.6 | 57,311.6 | 70,402.3 | 82,190.2 | 90,971.4 | 95,275.5 | 99,889.2 | 104,755.1 | 109,901.5 | 115,364.9 | |
| Effective tax rate | 12.0% | 13.3% | 15.1% | 18.7% | 16.0% | 16.0% | 16.0% | 16.0% | 16.0% | 16.0% | 16.0% | 16.0% | 16.0% | 16.0% | |
| Net income | 29,760.0 | 72,880.0 | 120,067.0 | 160,716.0 | 232,617.4 | 299,874.2 | 368,369.0 | 430,047.8 | 475,994.0 | 498,514.5 | 522,654.8 | 548,115.1 | 575,042.7 | 603,629.2 | |
| Net income to shareholders | 29,523.0 | 71,846.0 | 115,545.0 | 170,116.0 | 232,617.4 | 299,874.2 | 368,369.0 | 430,047.8 | 475,994.0 | 498,514.5 | 522,654.8 | 548,115.1 | 575,042.7 | 603,629.2 | |
| Net margin | 48.5% | 55.1% | 53.5% | 56.1% | 57.1% | 57.1% | 57.1% | 57.1% | 57.0% | 56.8% | 56.8% | 56.7% | 56.6% | 56.6% | |
| Earnings per share | 1.18 | 2.90 | 4.71 | 6.99 | 9.63 | 12.50 | 15.47 | 18.19 | 20.28 | 21.39 | 22.59 | 23.86 | 25.21 | 26.65 | |
| Cash flow | |||||||||||||||
| Cash flow from operations | 104,949.0 | 168,297.0 | 207,428.4 | 261,405.1 | 308,570.6 | 330,656.2 | 299,904.9 | 171,572.7 | (108,307.1) | (663,821.0) | (1,744,001.9) | (3,821,883.6) | |||
| Capex | 3,236.0 | 6,042.0 | 7,354.0 | 9,897.0 | 12,742.2 | 15,651.8 | 18,290.8 | 20,274.0 | 21,287.7 | 22,352.1 | 23,469.7 | 24,643.2 | 25,875.3 | ||
| Unlevered free cash flow | 98,281.1 | 140,556.2 | 210,366.7 | 273,021.1 | 339,853.8 | 403,027.6 | 454,040.2 | 485,085.9 | 509,600.1 | 535,263.7 | 562,163.6 | 590,375.2 | |||
| FCF margin | 45.5% | 46.4% | 51.6% | 52.0% | 52.7% | 53.5% | 54.4% | 55.3% | 55.3% | 55.4% | 55.4% | 55.4% | |||
| Balance sheet | |||||||||||||||
| Cash and cash equivalents | 8,589.0 | 10,605.0 | 22,443.0 | 23,427.5 | (250,388.2) | (1,457,173.4) | (5,666,101.1) | (19,413,210.6) | (63,737,376.3) | (206,866,682.7) | (671,881,035.1) | (2,191,609,229.4) | (7,181,346,171.7) | ||
| Financial debt | 8,463.0 | 8,468.0 | 33,366.0 | 27,616.0 | 24,116.0 | 22,616.0 | 17,366.0 | 17,366.0 | 13,866.0 | 13,866.0 | 13,866.0 | 9,866.0 | 9,866.0 | ||
| Lease liabilities | 1,519.0 | 2,572.0 | 4,985.0 | 4,985.0 | 4,985.0 | 4,985.0 | 4,985.0 | 4,985.0 | 4,985.0 | 4,985.0 | 4,985.0 | 4,985.0 | 4,985.0 | ||
| Net debt (financial debt − cash) | (126.0) | (2,137.0) | 10,923.0 | 4,188.5 | 274,504.2 | 1,479,789.4 | 5,683,467.1 | 19,430,576.6 | 63,751,242.3 | 206,880,548.7 | 671,894,901.1 | 2,191,619,095.4 | 7,181,356,037.7 | ||
| Total equity | 79,327.0 | 157,293.0 | 228,984.0 | 453,139.4 | 742,188.8 | 1,097,326.8 | 1,511,976.8 | 1,970,958.8 | 2,451,670.1 | 2,955,673.7 | 3,484,243.2 | 4,038,794.2 | 4,620,927.5 | ||
| Balance check (assets − liabilities − equity) | - | - | - | - | - | - | - | - | - | - | - | - | 0.0 | ||
| Key ratios | |||||||||||||||
| EBITDA margin | 56.6% | 63.8% | 63.8% | 69.5% | 69.5% | 69.5% | 69.5% | 69.5% | 69.5% | 69.5% | 69.5% | 69.5% | 69.5% | 69.5% | |
| ROIC (EBIT × (1 − t) ÷ average invested capital) | 87.5% | 96.0% | 83.6% | 66.1% | 40.6% | 20.5% | 8.8% | 3.3% | 1.1% | 0.4% | 0.1% | 0.0% | 0.0% | ||
| FCF margin | 45.5% | 46.4% | 51.6% | 52.0% | 52.7% | 53.5% | 54.4% | 55.3% | 55.3% | 55.4% | 55.4% | 55.4% | |||
| Net debt ÷ EBITDA | - | (0.02x) | 0.05x | 0.01x | 0.75x | 3.30x | 10.85x | 33.46x | 104.54x | 323.10x | 999.36x | 3104.55x | 9688.36x | ||
| EBITDA ÷ interest | 134.16x | 337.32x | 531.78x | 191.90x | 287.38x | 402.33x | 489.47x | 675.05x | 708.80x | 925.77x | 972.06x | 1020.66x | 1508.88x | ||
| Minimum DSCR over the projection | 29.14x | ||||||||||||||
How revenue is built
Skale reads the documents to decide how each revenue stream is projected, and explains why.
The documents give no operational volume or price history for Compute & Networking. Revenue splits by end market are money splits, which add nothing over the segment growing on its own. The current growth build is the best the documents support. Growth is held rather than stepped: the historical growth of 145%, 67% and 42% is decelerating, and the 10-Q base-year growth of 42% is already reflected in the base.
No volume or price history for GPUs is disclosed, so the current growth build remains the best supported.
Build this for your company
Upload your financial statements; Skale builds the model, and you review the assumptions.
Get startedNew to financial models? What is a financial model?