Microsoft financial model
Skale built this Excel financial model of Microsoft automatically from two published financial statement documents. It is a three-statement model with ten projected years, Sep-28E to Sep-37E, and a DCF valuation, across six sheets. For LTM Sep-26 it shows revenue of $346.4 billion, net income to shareholders of $142.6 billion and net debt of $15.2 billion. The DCF enterprise value is $1.4 trillion under the model's assumptions.
Preview the Excel
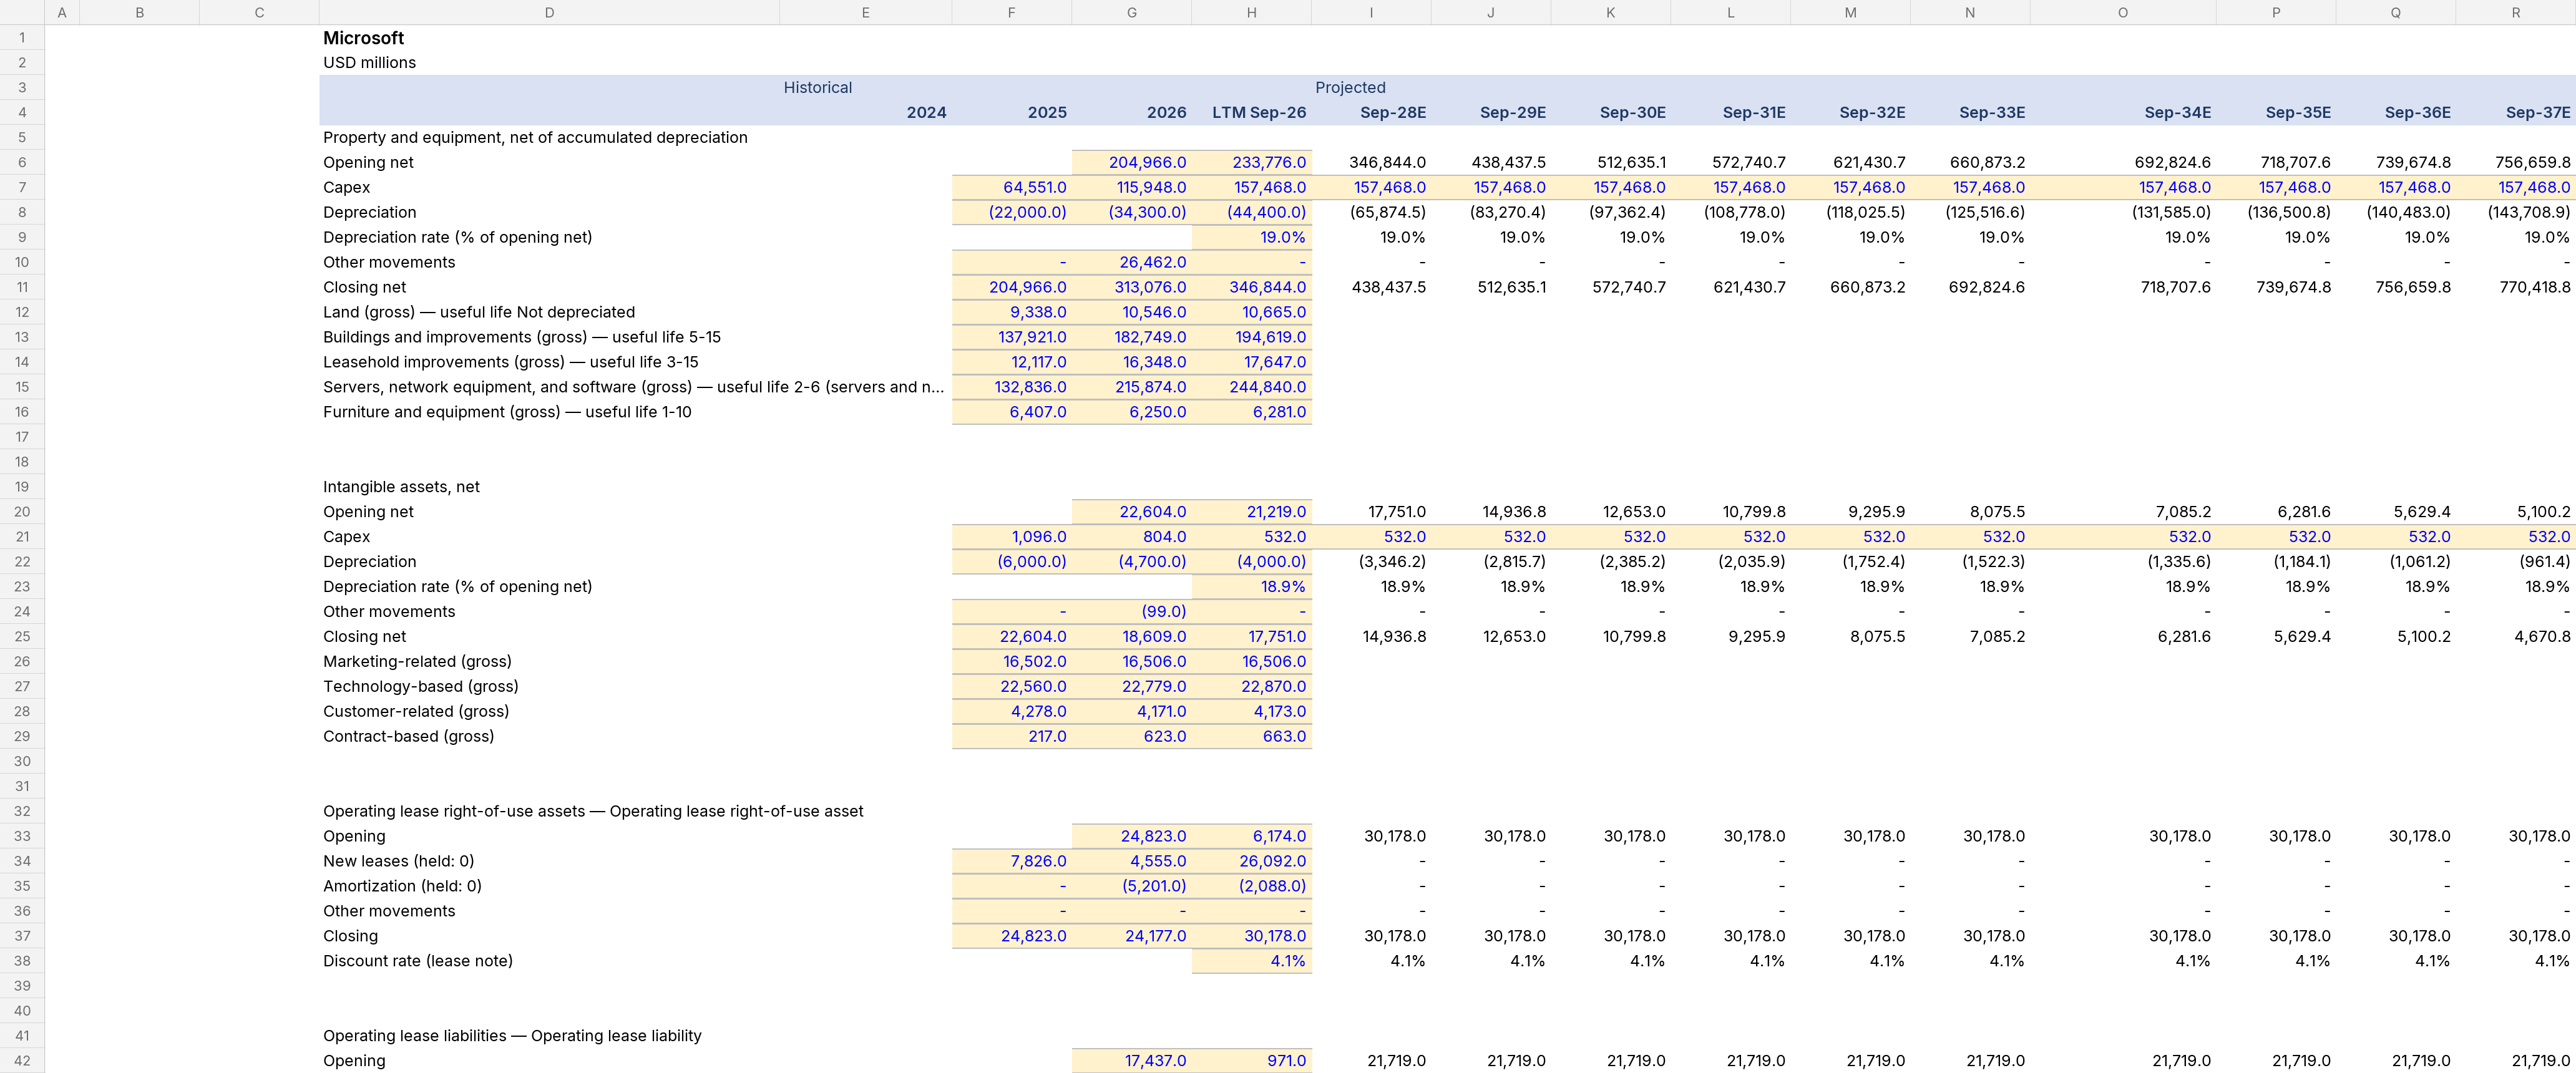
The first rows of each sheet, as they open in Excel.
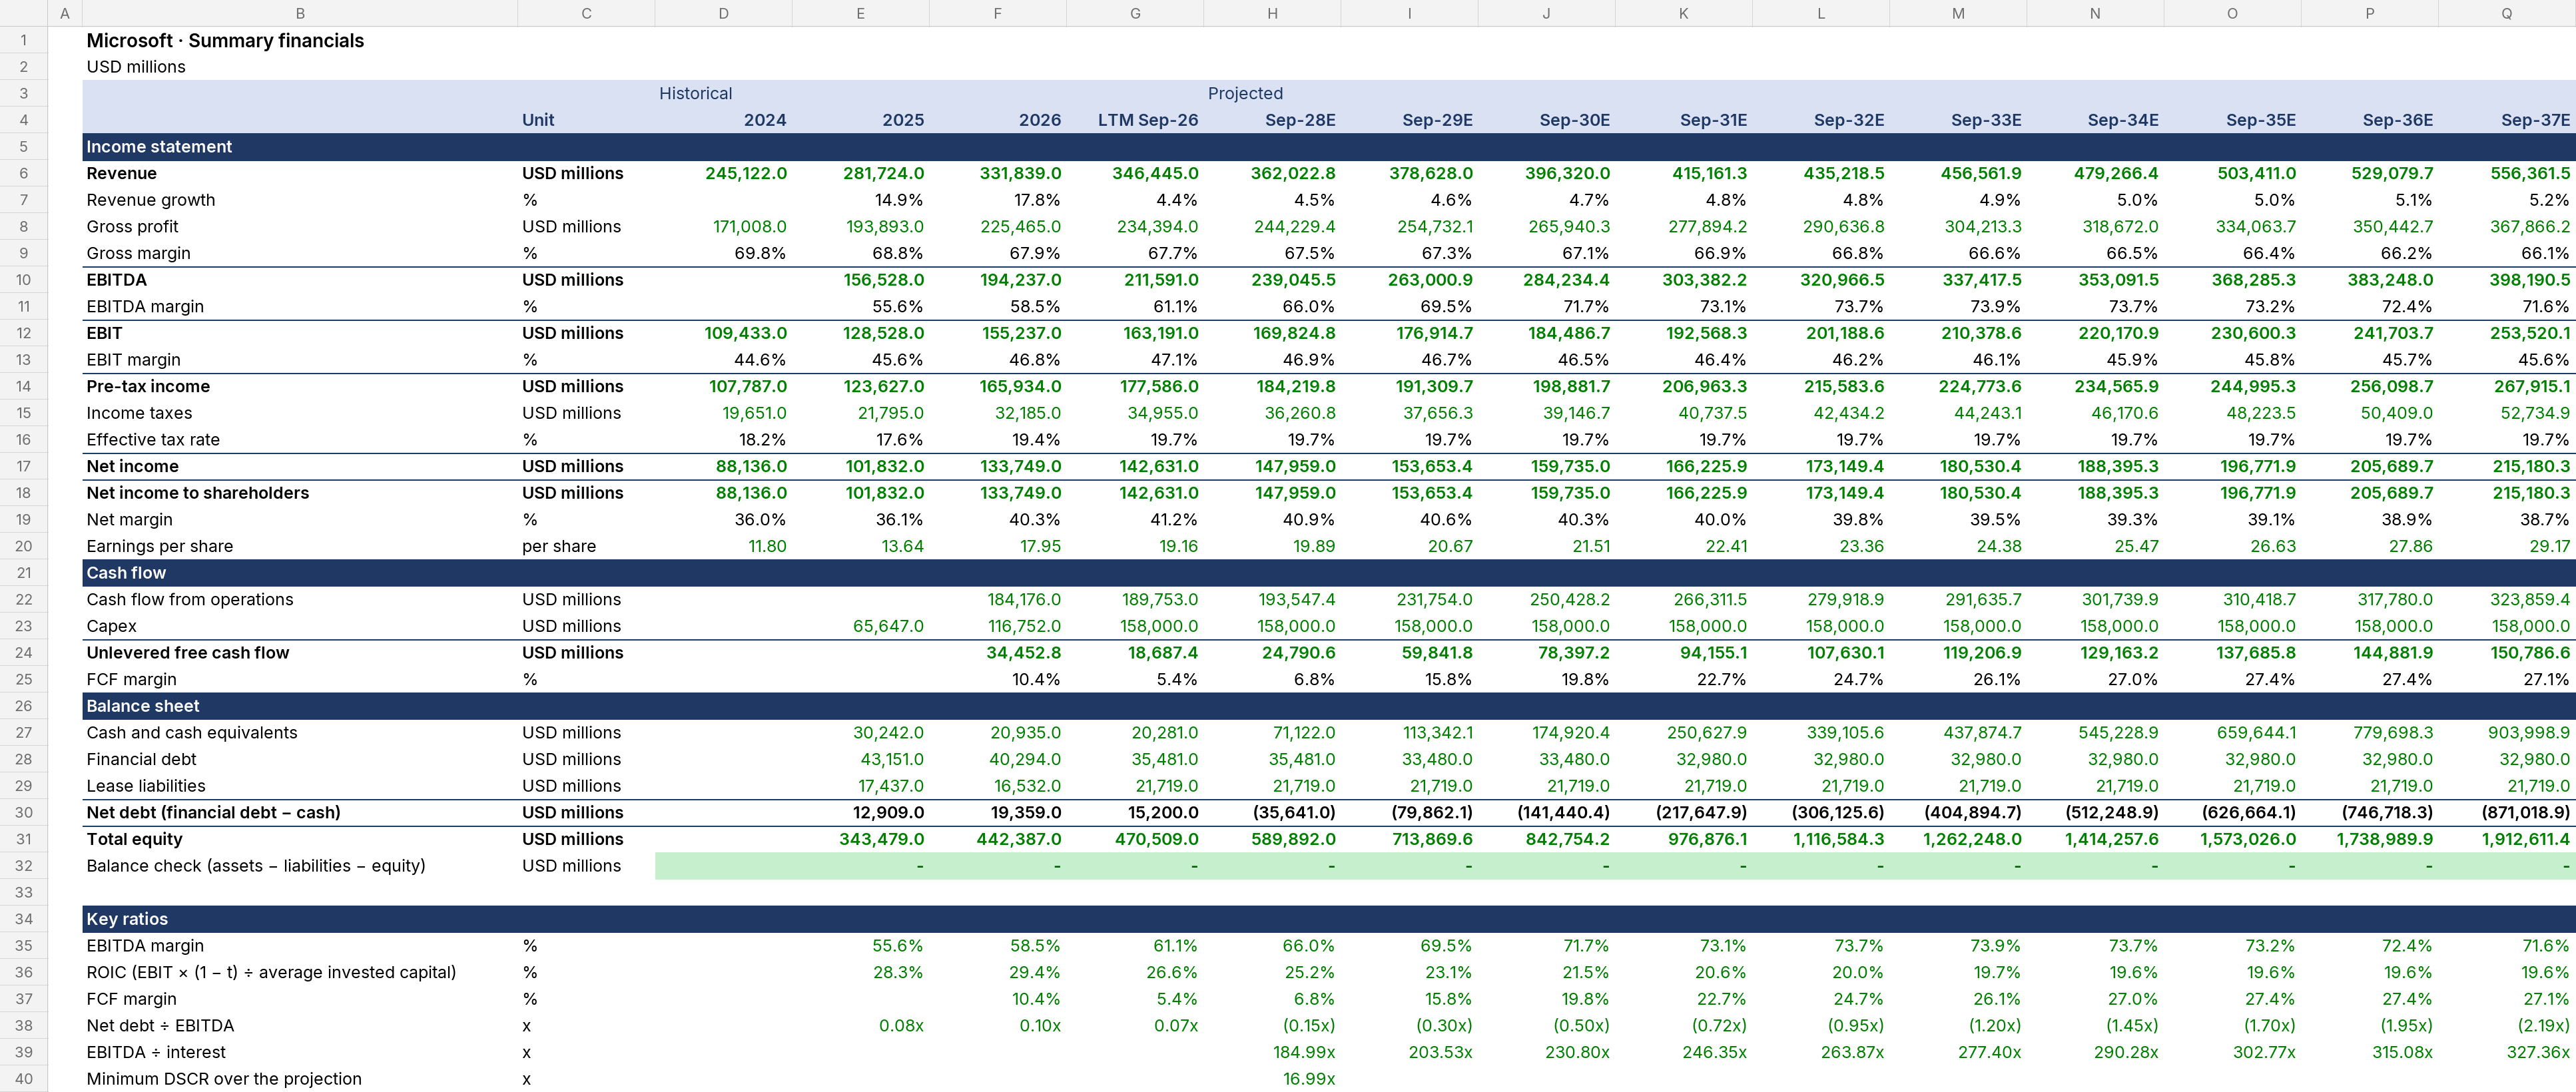
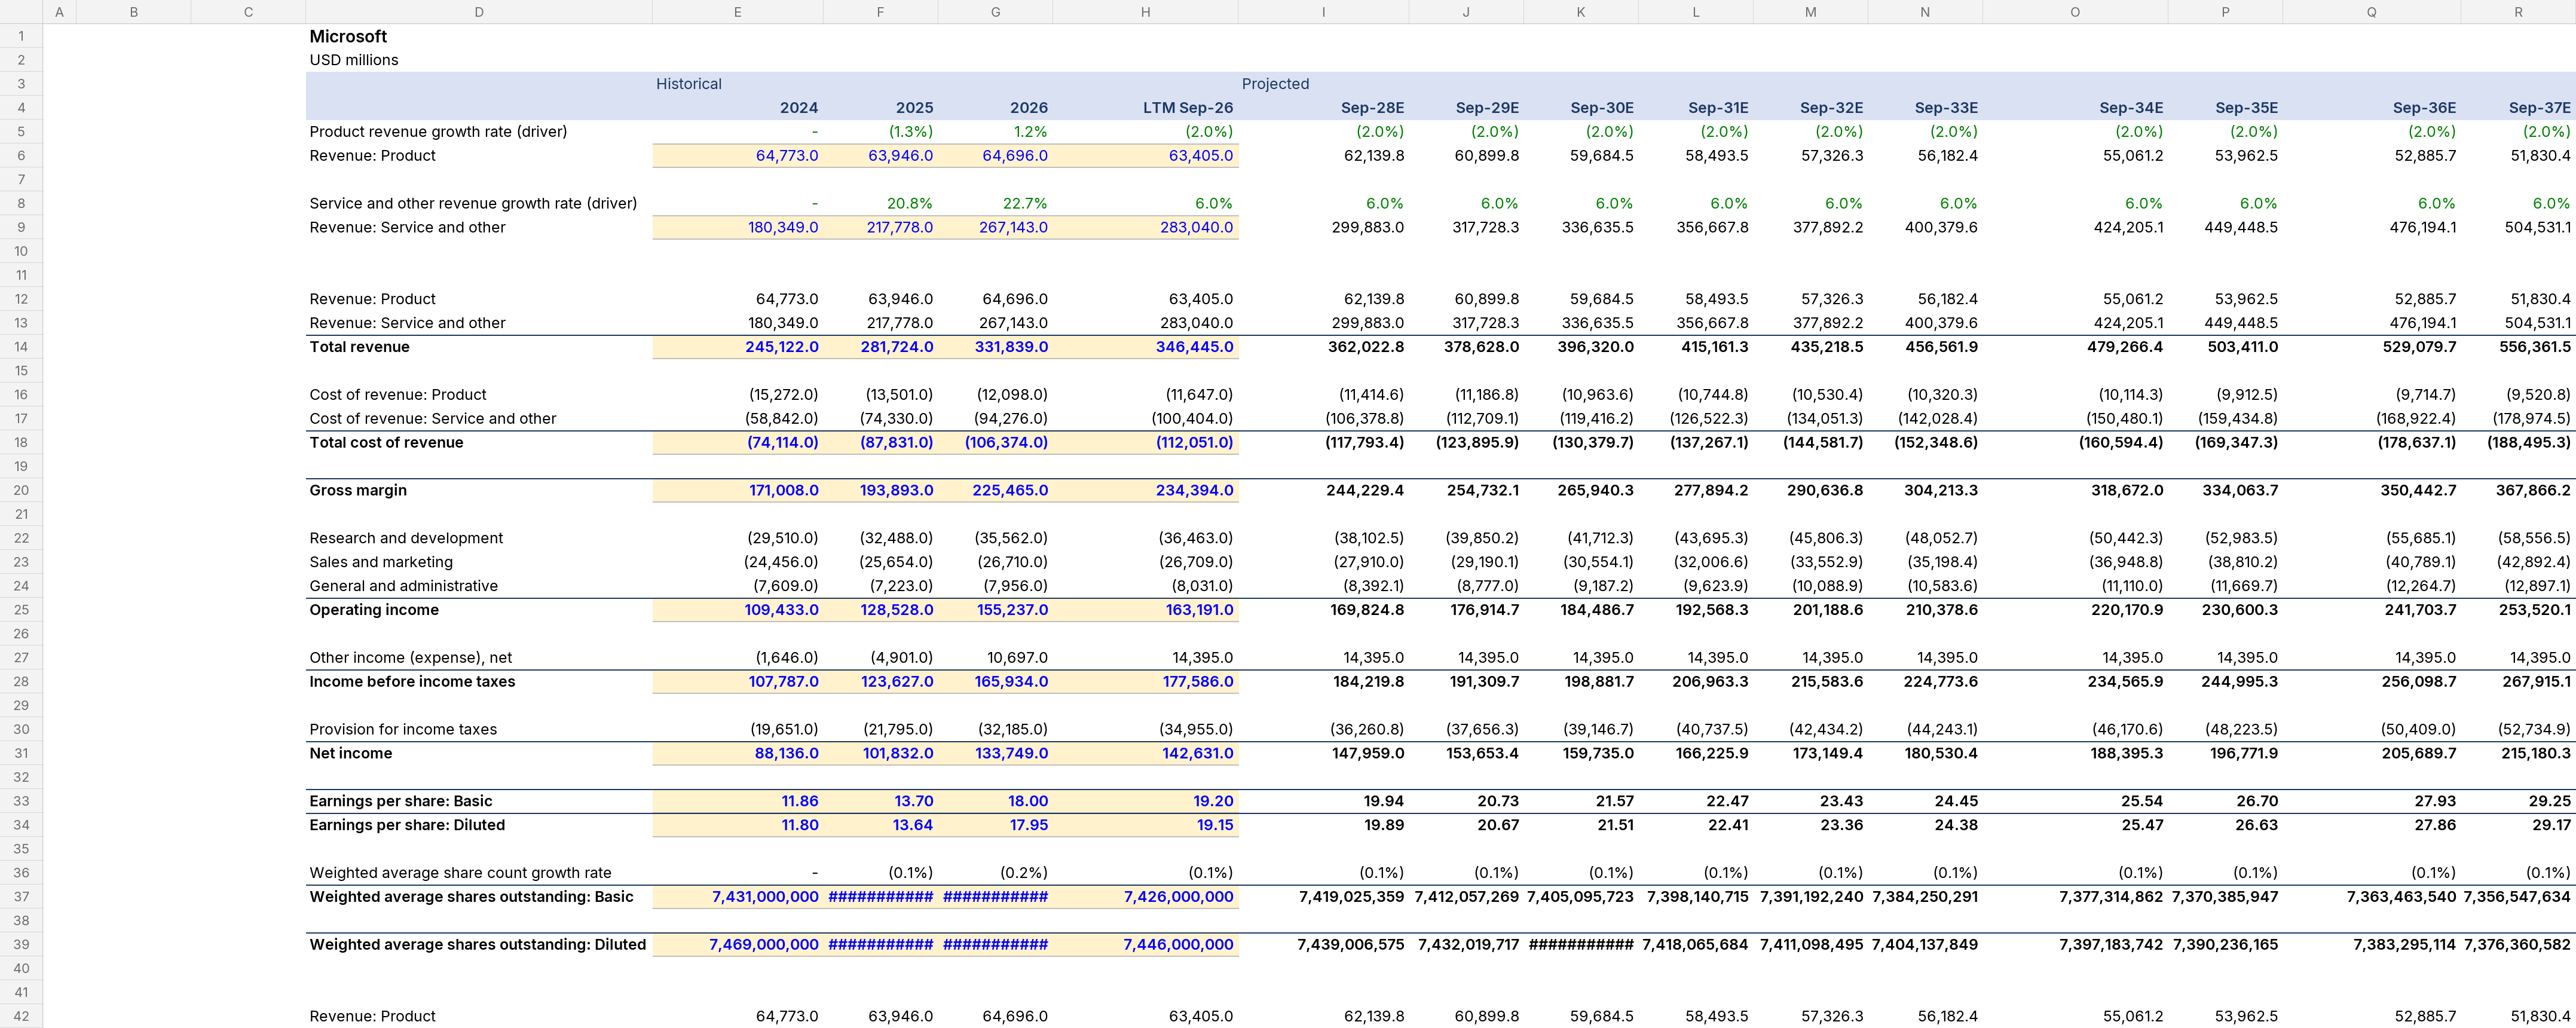
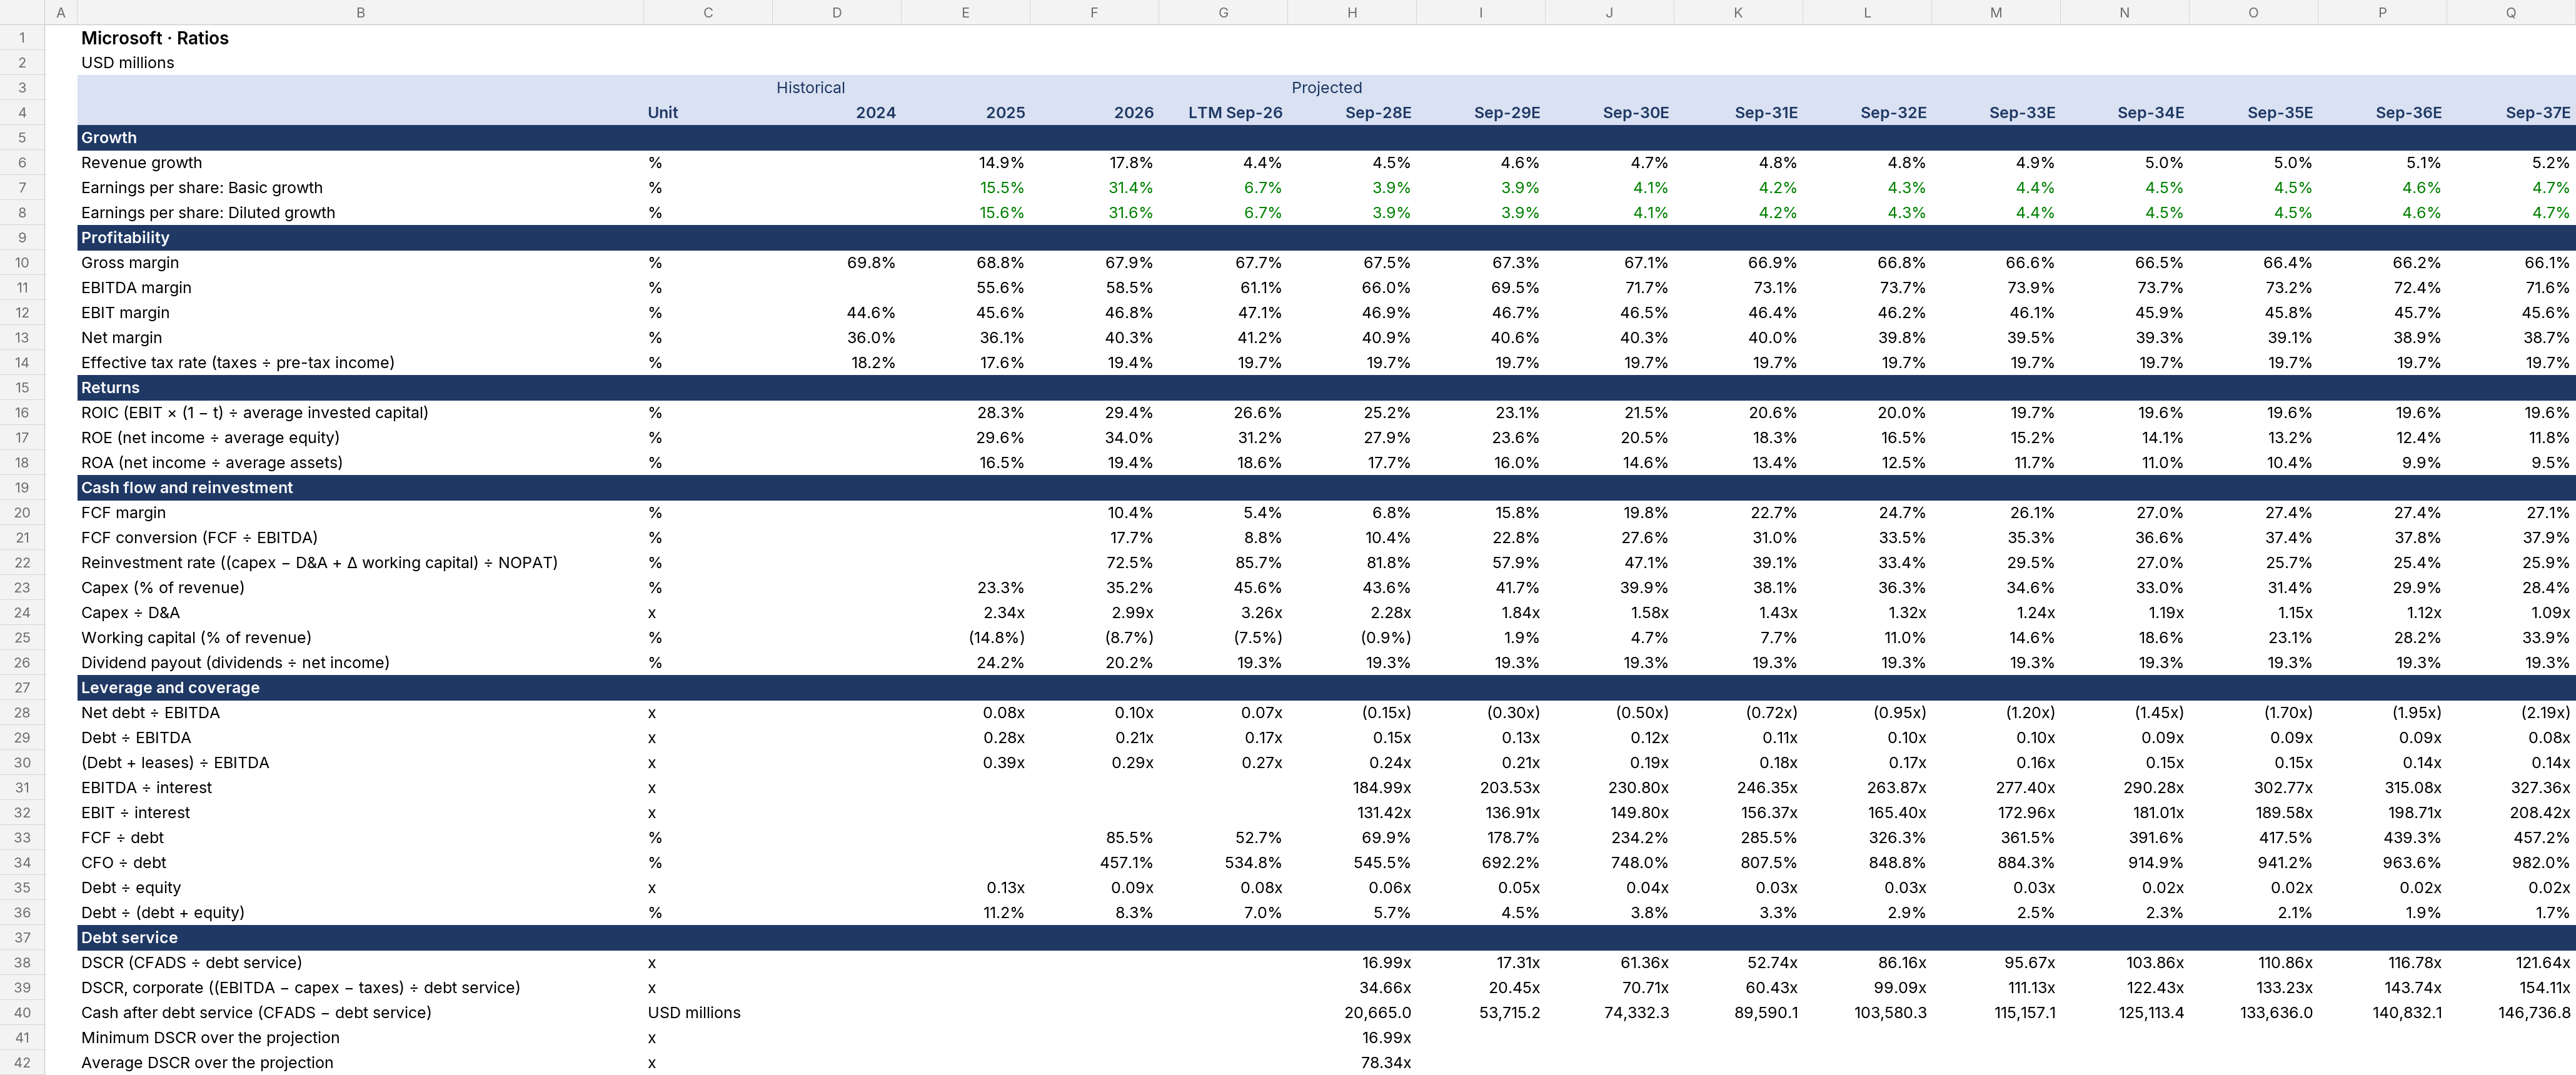
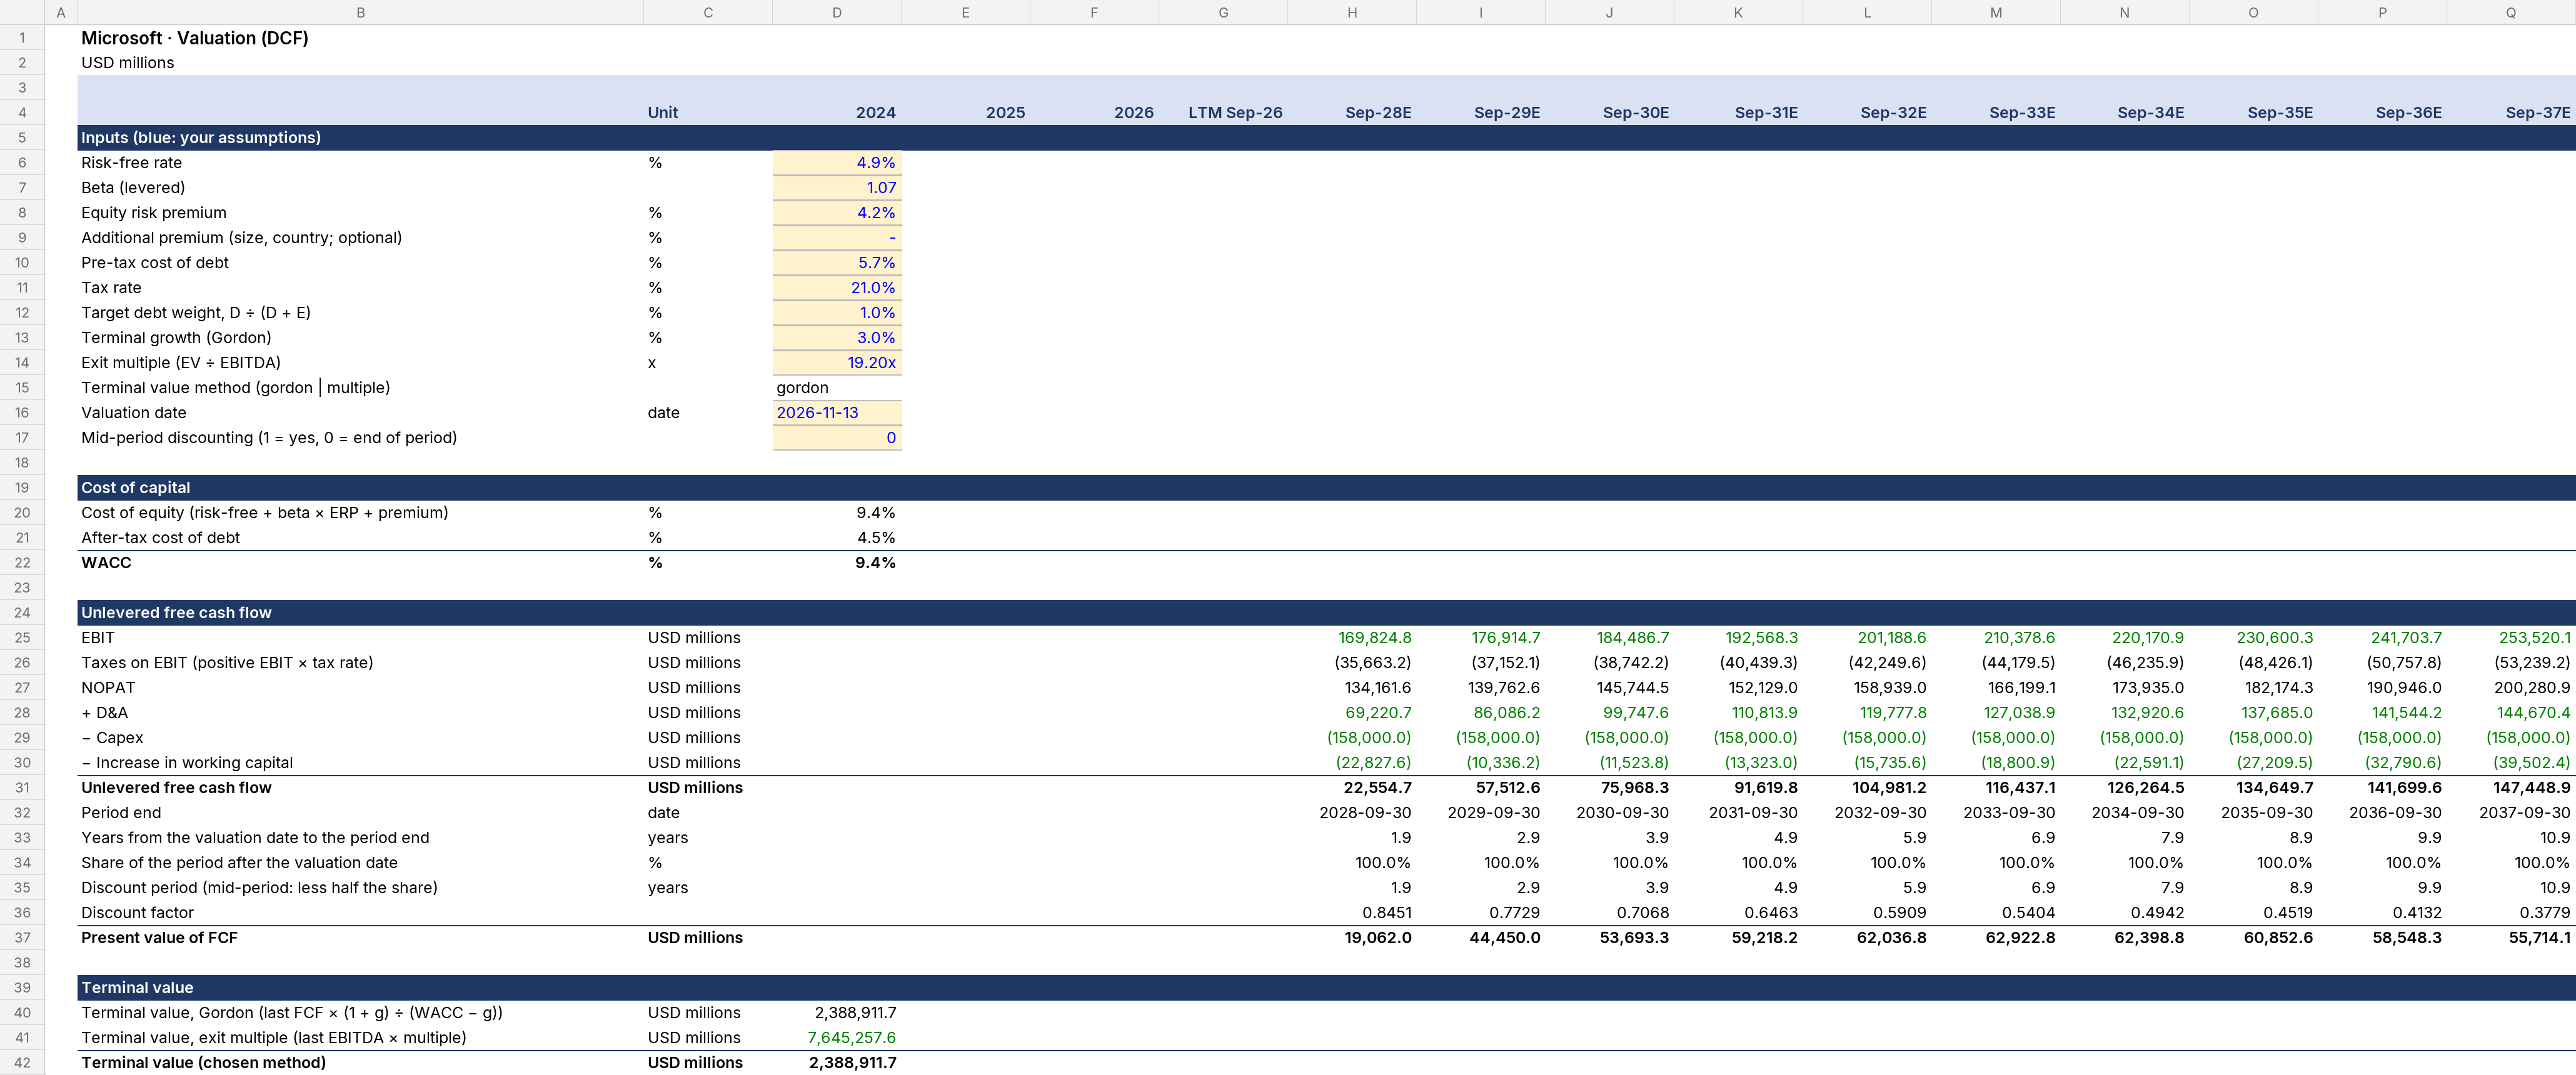
Microsoft summary financials
USD millions · historical and projected years 2024–2037. From the model's Summary sheet; every projected figure is a formula in the Excel.
| Historical | Projected | ||||||||||||||
|---|---|---|---|---|---|---|---|---|---|---|---|---|---|---|---|
| USD millions | Unit | 2024 | 2025 | 2026 | 2027 | 2028E | 2029E | 2030E | 2031E | 2032E | 2033E | 2034E | 2035E | 2036E | 2037E |
| Income statement | |||||||||||||||
| Revenue | USD millions | 245,122.0 | 281,724.0 | 331,839.0 | 346,445.0 | 362,022.8 | 378,628.0 | 396,320.0 | 415,161.3 | 435,218.5 | 456,561.9 | 479,266.4 | 503,411.0 | 529,079.7 | 556,361.5 |
| Revenue growth | % | 14.9% | 17.8% | 4.4% | 4.5% | 4.6% | 4.7% | 4.8% | 4.8% | 4.9% | 5.0% | 5.0% | 5.1% | 5.2% | |
| Gross profit | USD millions | 171,008.0 | 193,893.0 | 225,465.0 | 234,394.0 | 244,229.4 | 254,732.1 | 265,940.3 | 277,894.2 | 290,636.8 | 304,213.3 | 318,672.0 | 334,063.7 | 350,442.7 | 367,866.2 |
| Gross margin | % | 69.8% | 68.8% | 67.9% | 67.7% | 67.5% | 67.3% | 67.1% | 66.9% | 66.8% | 66.6% | 66.5% | 66.4% | 66.2% | 66.1% |
| EBITDA | USD millions | 156,528.0 | 194,237.0 | 211,591.0 | 239,045.5 | 263,000.9 | 284,234.4 | 303,382.2 | 320,966.5 | 337,417.5 | 353,091.5 | 368,285.3 | 383,248.0 | 398,190.5 | |
| EBITDA margin | % | 55.6% | 58.5% | 61.1% | 66.0% | 69.5% | 71.7% | 73.1% | 73.7% | 73.9% | 73.7% | 73.2% | 72.4% | 71.6% | |
| EBIT | USD millions | 109,433.0 | 128,528.0 | 155,237.0 | 163,191.0 | 169,824.8 | 176,914.7 | 184,486.7 | 192,568.3 | 201,188.6 | 210,378.6 | 220,170.9 | 230,600.3 | 241,703.7 | 253,520.1 |
| EBIT margin | % | 44.6% | 45.6% | 46.8% | 47.1% | 46.9% | 46.7% | 46.5% | 46.4% | 46.2% | 46.1% | 45.9% | 45.8% | 45.7% | 45.6% |
| Pre-tax income | USD millions | 107,787.0 | 123,627.0 | 165,934.0 | 177,586.0 | 184,219.8 | 191,309.7 | 198,881.7 | 206,963.3 | 215,583.6 | 224,773.6 | 234,565.9 | 244,995.3 | 256,098.7 | 267,915.1 |
| Income taxes | USD millions | 19,651.0 | 21,795.0 | 32,185.0 | 34,955.0 | 36,260.8 | 37,656.3 | 39,146.7 | 40,737.5 | 42,434.2 | 44,243.1 | 46,170.6 | 48,223.5 | 50,409.0 | 52,734.9 |
| Effective tax rate | % | 18.2% | 17.6% | 19.4% | 19.7% | 19.7% | 19.7% | 19.7% | 19.7% | 19.7% | 19.7% | 19.7% | 19.7% | 19.7% | 19.7% |
| Net income | USD millions | 88,136.0 | 101,832.0 | 133,749.0 | 142,631.0 | 147,959.0 | 153,653.4 | 159,735.0 | 166,225.9 | 173,149.4 | 180,530.4 | 188,395.3 | 196,771.9 | 205,689.7 | 215,180.3 |
| Net income to shareholders | USD millions | 88,136.0 | 101,832.0 | 133,749.0 | 142,631.0 | 147,959.0 | 153,653.4 | 159,735.0 | 166,225.9 | 173,149.4 | 180,530.4 | 188,395.3 | 196,771.9 | 205,689.7 | 215,180.3 |
| Net margin | % | 36.0% | 36.1% | 40.3% | 41.2% | 40.9% | 40.6% | 40.3% | 40.0% | 39.8% | 39.5% | 39.3% | 39.1% | 38.9% | 38.7% |
| Earnings per share | per share | 11.80 | 13.64 | 17.95 | 19.16 | 19.89 | 20.67 | 21.51 | 22.41 | 23.36 | 24.38 | 25.47 | 26.63 | 27.86 | 29.17 |
| Cash flow | |||||||||||||||
| Cash flow from operations | USD millions | 184,176.0 | 189,753.0 | 193,547.4 | 231,754.0 | 250,428.2 | 266,311.5 | 279,918.9 | 291,635.7 | 301,739.9 | 310,418.7 | 317,780.0 | 323,859.4 | ||
| Capex | USD millions | 65,647.0 | 116,752.0 | 158,000.0 | 158,000.0 | 158,000.0 | 158,000.0 | 158,000.0 | 158,000.0 | 158,000.0 | 158,000.0 | 158,000.0 | 158,000.0 | 158,000.0 | |
| Unlevered free cash flow | USD millions | 34,452.8 | 18,687.4 | 24,790.6 | 59,841.8 | 78,397.2 | 94,155.1 | 107,630.1 | 119,206.9 | 129,163.2 | 137,685.8 | 144,881.9 | 150,786.6 | ||
| FCF margin | % | 10.4% | 5.4% | 6.8% | 15.8% | 19.8% | 22.7% | 24.7% | 26.1% | 27.0% | 27.4% | 27.4% | 27.1% | ||
| Balance sheet | |||||||||||||||
| Cash and cash equivalents | USD millions | 30,242.0 | 20,935.0 | 20,281.0 | 71,122.0 | 113,342.1 | 174,920.4 | 250,627.9 | 339,105.6 | 437,874.7 | 545,228.9 | 659,644.1 | 779,698.3 | 903,998.9 | |
| Financial debt | USD millions | 43,151.0 | 40,294.0 | 35,481.0 | 35,481.0 | 33,480.0 | 33,480.0 | 32,980.0 | 32,980.0 | 32,980.0 | 32,980.0 | 32,980.0 | 32,980.0 | 32,980.0 | |
| Lease liabilities | USD millions | 17,437.0 | 16,532.0 | 21,719.0 | 21,719.0 | 21,719.0 | 21,719.0 | 21,719.0 | 21,719.0 | 21,719.0 | 21,719.0 | 21,719.0 | 21,719.0 | 21,719.0 | |
| Net debt (financial debt − cash) | USD millions | 12,909.0 | 19,359.0 | 15,200.0 | (35,641.0) | (79,862.1) | (141,440.4) | (217,647.9) | (306,125.6) | (404,894.7) | (512,248.9) | (626,664.1) | (746,718.3) | (871,018.9) | |
| Total equity | USD millions | 343,479.0 | 442,387.0 | 470,509.0 | 589,892.0 | 713,869.6 | 842,754.2 | 976,876.1 | 1,116,584.3 | 1,262,248.0 | 1,414,257.6 | 1,573,026.0 | 1,738,989.9 | 1,912,611.4 | |
| Balance check (assets − liabilities − equity) | USD millions | - | - | - | - | - | - | - | - | - | - | - | - | - | |
| Key ratios | |||||||||||||||
| EBITDA margin | % | 55.6% | 58.5% | 61.1% | 66.0% | 69.5% | 71.7% | 73.1% | 73.7% | 73.9% | 73.7% | 73.2% | 72.4% | 71.6% | |
| ROIC (EBIT × (1 − t) ÷ average invested capital) | % | 28.3% | 29.4% | 26.6% | 25.2% | 23.1% | 21.5% | 20.6% | 20.0% | 19.7% | 19.6% | 19.6% | 19.6% | 19.6% | |
| FCF margin | % | 10.4% | 5.4% | 6.8% | 15.8% | 19.8% | 22.7% | 24.7% | 26.1% | 27.0% | 27.4% | 27.4% | 27.1% | ||
| Net debt ÷ EBITDA | x | 0.08x | 0.10x | 0.07x | (0.15x) | (0.30x) | (0.50x) | (0.72x) | (0.95x) | (1.20x) | (1.45x) | (1.70x) | (1.95x) | (2.19x) | |
| EBITDA ÷ interest | x | 184.99x | 203.53x | 230.80x | 246.35x | 263.87x | 277.40x | 290.28x | 302.77x | 315.08x | 327.36x | ||||
| Minimum DSCR over the projection | x | 16.99x | |||||||||||||
How revenue is built
Skale reads the documents to decide how each revenue stream is projected, and explains why.
Product revenue was flat to slightly up over FY2024-FY2026 (64.8bn, 63.9bn, 64.7bn) and no unit volumes are disclosed. A held formula repeats the last value, so it is replaced with growth on a held growth driver (new line) that continues the Product history. Better builds need data the documents do not give (see data request).
Service and other revenue grew 20.8% in FY2025 and 22.7% in FY2026, with the base period near 283bn. No seat counts, volumes or consistent multi-year usage data are disclosed, and the Microsoft Cloud figure covers only part of the stream, so a held formula is replaced by growth on a held growth driver (new line). A stepped path eases growth as the base gets large.
Build this for your company
Upload your financial statements; Skale builds the model, and you review the assumptions.
Get startedNew to financial models? What is a financial model?