AST Spacemobile financial model
AST Spacemobile financial model in Excel: a 3-statement model (income statement, balance sheet, cash flow) with a DCF valuation, 2024–2036, built automatically by Skale from 8 published documents.
Preview the Excel
The first rows of each sheet, as they open in Excel.
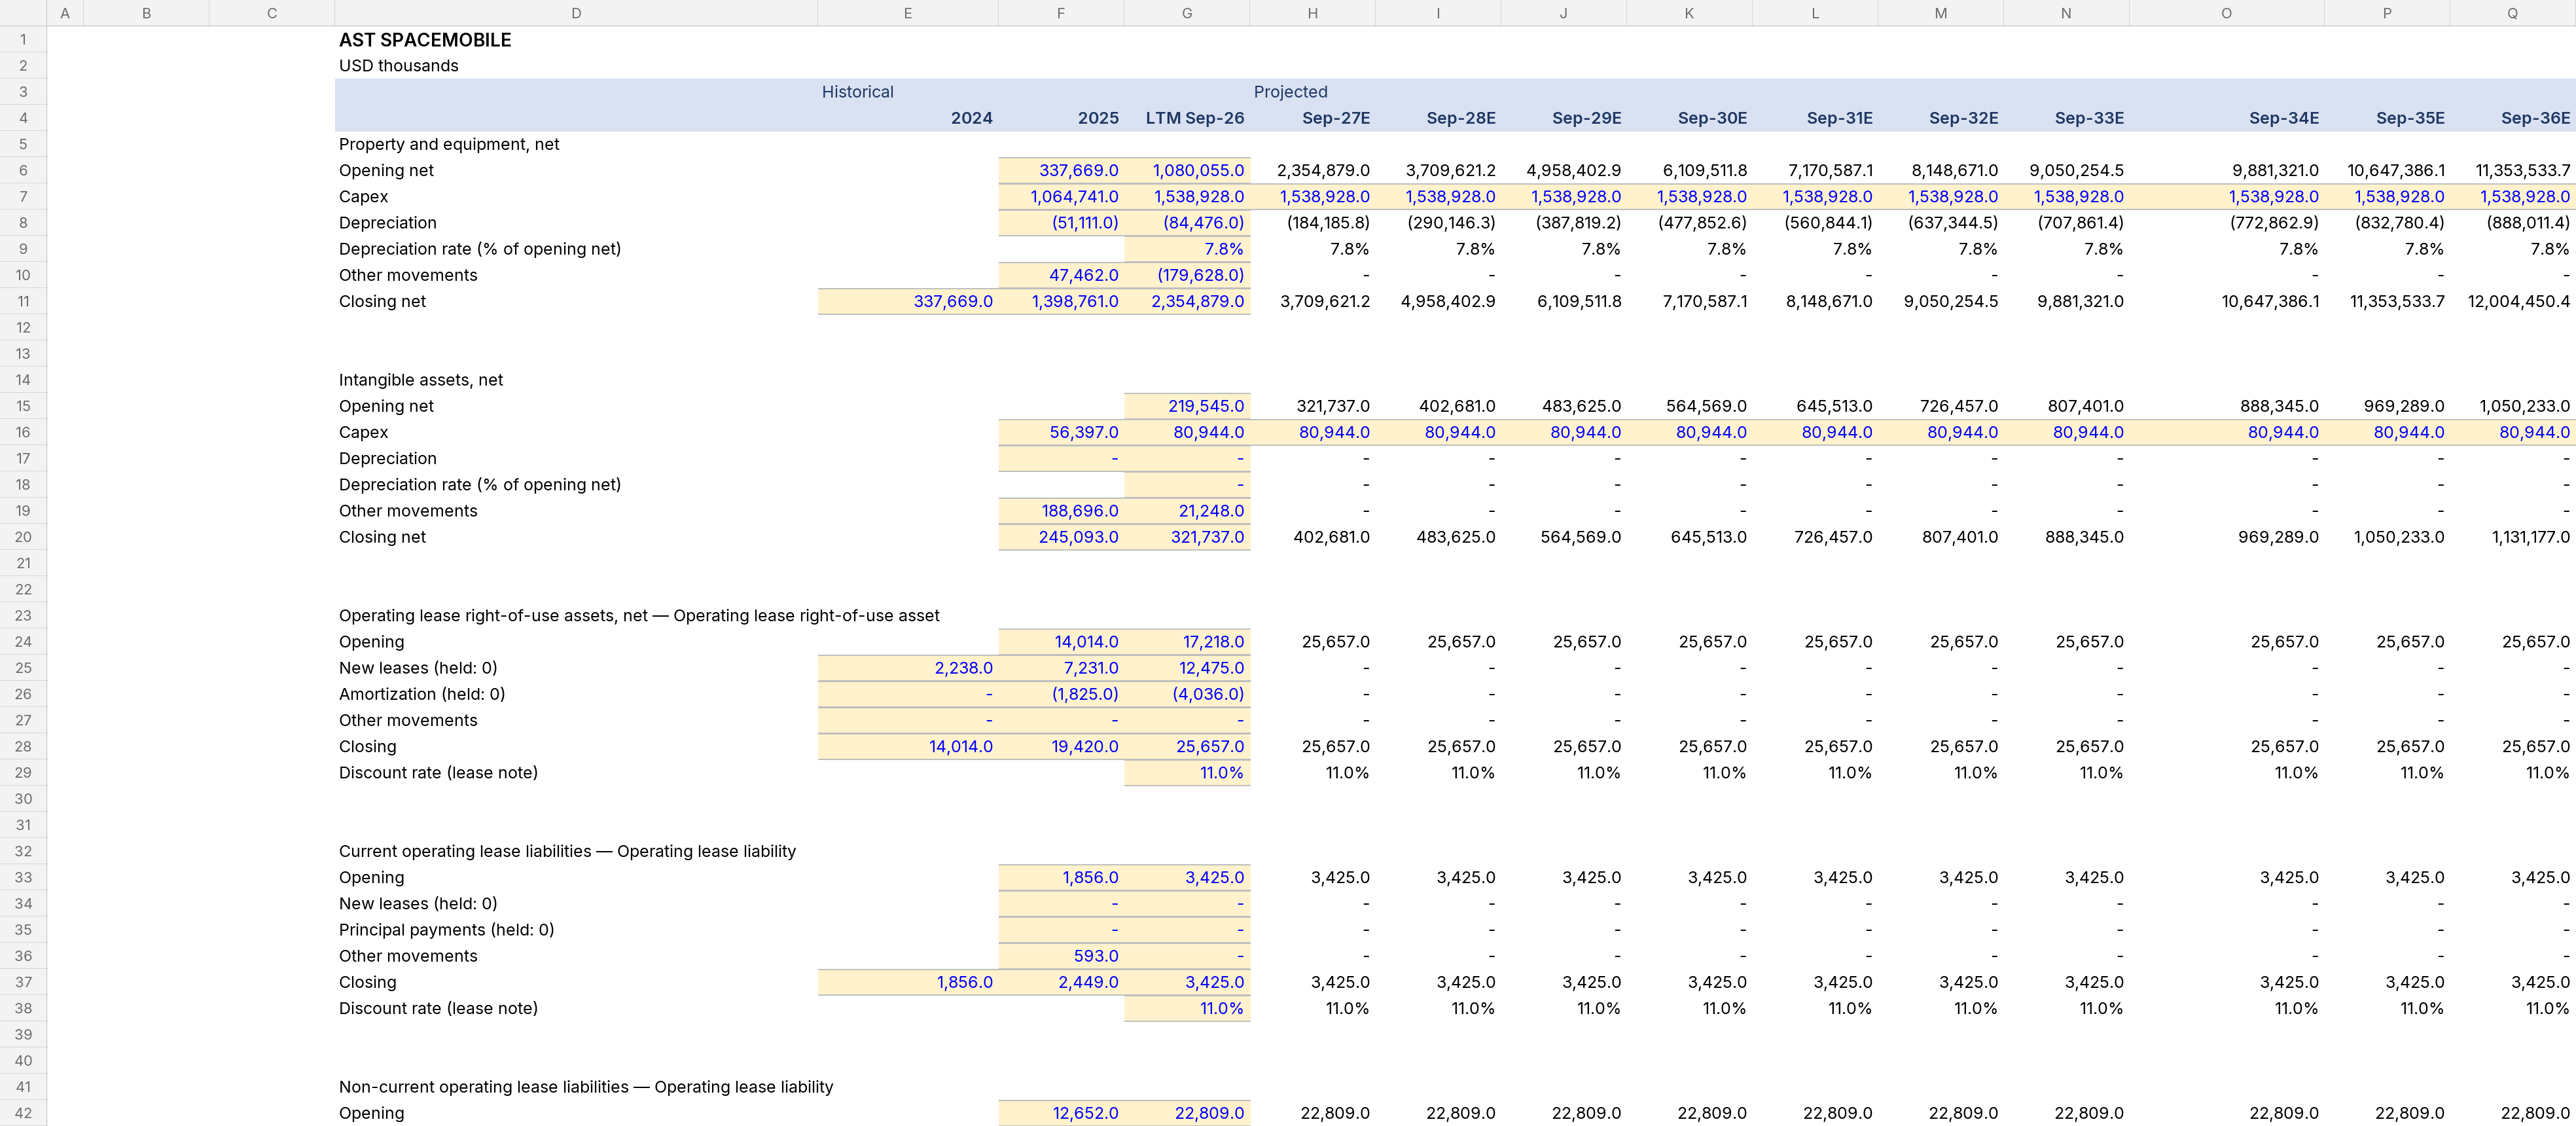
AST Spacemobile summary financials
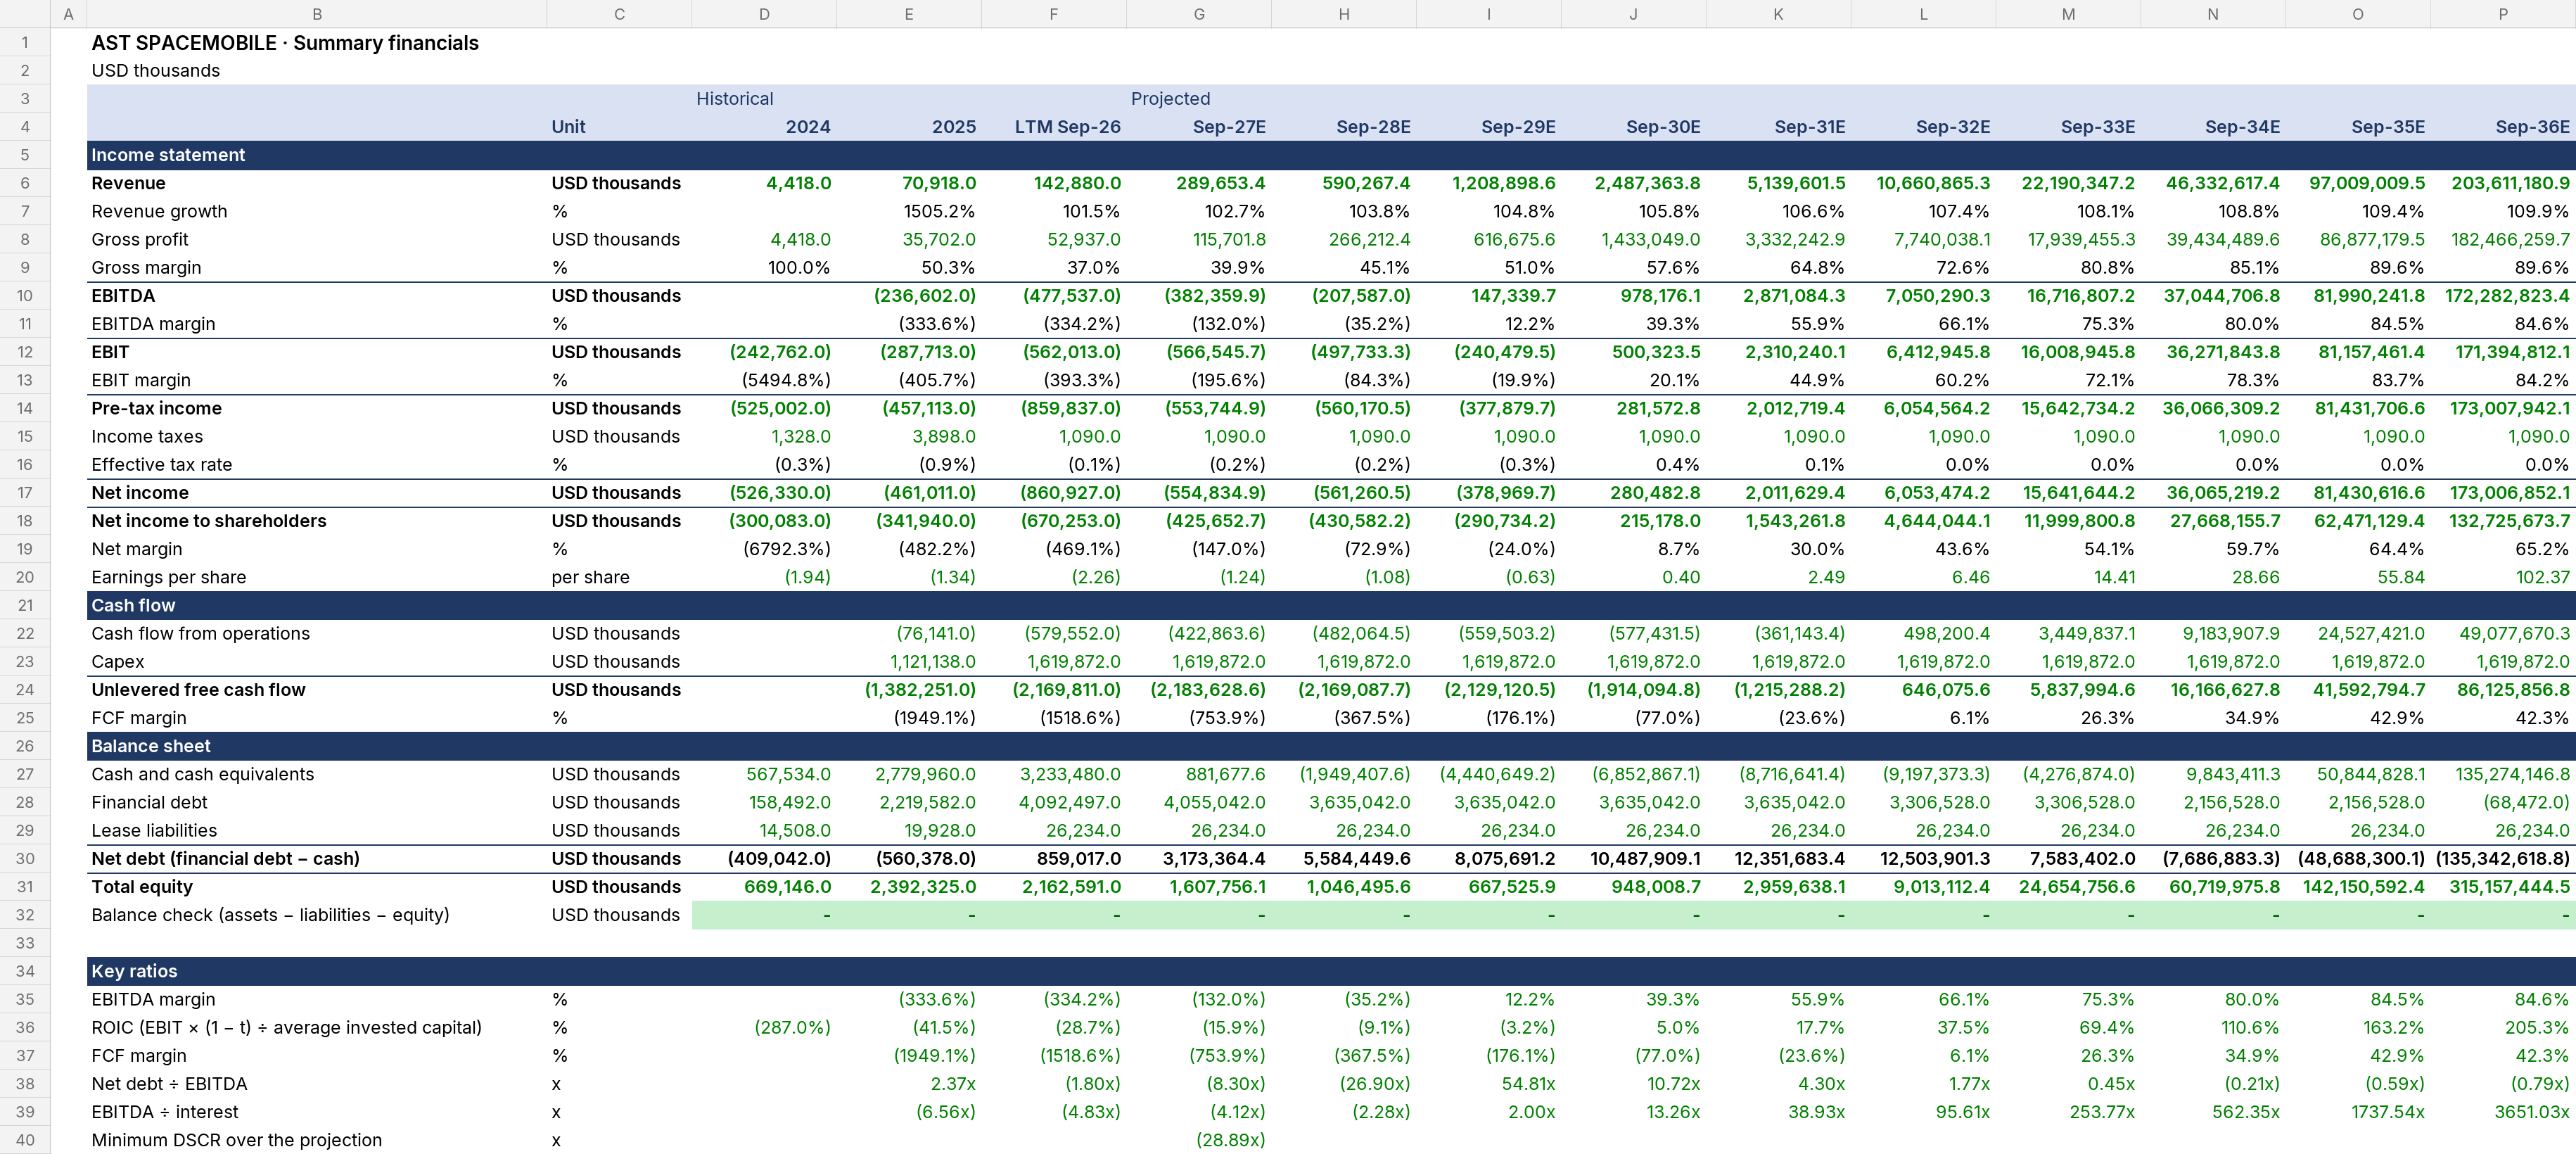
USD thousands · historical and projected years 2024–2036. From the model's Summary sheet; every projected figure is a formula in the Excel.
| Historical | Projected | |||||||||||||
|---|---|---|---|---|---|---|---|---|---|---|---|---|---|---|
| USD thousands | Unit | 2024 | 2025 | 2026 | 2027E | 2028E | 2029E | 2030E | 2031E | 2032E | 2033E | 2034E | 2035E | 2036E |
| Income statement | ||||||||||||||
| Revenue | USD thousands | 4,418.0 | 70,918.0 | 142,880.0 | 289,653.4 | 590,267.4 | 1,208,898.6 | 2,487,363.8 | 5,139,601.5 | 10,660,865.3 | 22,190,347.2 | 46,332,617.4 | 97,009,009.5 | 203,611,180.9 |
| Revenue growth | % | 1505.2% | 101.5% | 102.7% | 103.8% | 104.8% | 105.8% | 106.6% | 107.4% | 108.1% | 108.8% | 109.4% | 109.9% | |
| Gross profit | USD thousands | 4,418.0 | 35,702.0 | 52,937.0 | 115,701.8 | 266,212.4 | 616,675.6 | 1,433,049.0 | 3,332,242.9 | 7,740,038.1 | 17,939,455.3 | 39,434,489.6 | 86,877,179.5 | 182,466,259.7 |
| Gross margin | % | 100.0% | 50.3% | 37.0% | 39.9% | 45.1% | 51.0% | 57.6% | 64.8% | 72.6% | 80.8% | 85.1% | 89.6% | 89.6% |
| EBITDA | USD thousands | (236,602.0) | (477,537.0) | (382,359.9) | (207,587.0) | 147,339.7 | 978,176.1 | 2,871,084.3 | 7,050,290.3 | 16,716,807.2 | 37,044,706.8 | 81,990,241.8 | 172,282,823.4 | |
| EBITDA margin | % | (333.6%) | (334.2%) | (132.0%) | (35.2%) | 12.2% | 39.3% | 55.9% | 66.1% | 75.3% | 80.0% | 84.5% | 84.6% | |
| EBIT | USD thousands | (242,762.0) | (287,713.0) | (562,013.0) | (566,545.7) | (497,733.3) | (240,479.5) | 500,323.5 | 2,310,240.1 | 6,412,945.8 | 16,008,945.8 | 36,271,843.8 | 81,157,461.4 | 171,394,812.1 |
| EBIT margin | % | (5494.8%) | (405.7%) | (393.3%) | (195.6%) | (84.3%) | (19.9%) | 20.1% | 44.9% | 60.2% | 72.1% | 78.3% | 83.7% | 84.2% |
| Pre-tax income | USD thousands | (525,002.0) | (457,113.0) | (859,837.0) | (553,744.9) | (560,170.5) | (377,879.7) | 281,572.8 | 2,012,719.4 | 6,054,564.2 | 15,642,734.2 | 36,066,309.2 | 81,431,706.6 | 173,007,942.1 |
| Income taxes | USD thousands | 1,328.0 | 3,898.0 | 1,090.0 | 1,090.0 | 1,090.0 | 1,090.0 | 1,090.0 | 1,090.0 | 1,090.0 | 1,090.0 | 1,090.0 | 1,090.0 | 1,090.0 |
| Effective tax rate | % | (0.3%) | (0.9%) | (0.1%) | (0.2%) | (0.2%) | (0.3%) | 0.4% | 0.1% | 0.0% | 0.0% | 0.0% | 0.0% | 0.0% |
| Net income | USD thousands | (526,330.0) | (461,011.0) | (860,927.0) | (554,834.9) | (561,260.5) | (378,969.7) | 280,482.8 | 2,011,629.4 | 6,053,474.2 | 15,641,644.2 | 36,065,219.2 | 81,430,616.6 | 173,006,852.1 |
| Net income to shareholders | USD thousands | (300,083.0) | (341,940.0) | (670,253.0) | (425,652.7) | (430,582.2) | (290,734.2) | 215,178.0 | 1,543,261.8 | 4,644,044.1 | 11,999,800.8 | 27,668,155.7 | 62,471,129.4 | 132,725,673.7 |
| Net margin | % | (6792.3%) | (482.2%) | (469.1%) | (147.0%) | (72.9%) | (24.0%) | 8.7% | 30.0% | 43.6% | 54.1% | 59.7% | 64.4% | 65.2% |
| Earnings per share | per share | (1.94) | (1.34) | (2.26) | (1.24) | (1.08) | (0.63) | 0.40 | 2.49 | 6.46 | 14.41 | 28.66 | 55.84 | 102.37 |
| Cash flow | ||||||||||||||
| Cash flow from operations | USD thousands | (76,141.0) | (579,552.0) | (422,863.6) | (482,064.5) | (559,503.2) | (577,431.5) | (361,143.4) | 498,200.4 | 3,449,837.1 | 9,183,907.9 | 24,527,421.0 | 49,077,670.3 | |
| Capex | USD thousands | 1,121,138.0 | 1,619,872.0 | 1,619,872.0 | 1,619,872.0 | 1,619,872.0 | 1,619,872.0 | 1,619,872.0 | 1,619,872.0 | 1,619,872.0 | 1,619,872.0 | 1,619,872.0 | 1,619,872.0 | |
| Unlevered free cash flow | USD thousands | (1,382,251.0) | (2,169,811.0) | (2,183,628.6) | (2,169,087.7) | (2,129,120.5) | (1,914,094.8) | (1,215,288.2) | 646,075.6 | 5,837,994.6 | 16,166,627.8 | 41,592,794.7 | 86,125,856.8 | |
| FCF margin | % | (1949.1%) | (1518.6%) | (753.9%) | (367.5%) | (176.1%) | (77.0%) | (23.6%) | 6.1% | 26.3% | 34.9% | 42.9% | 42.3% | |
| Balance sheet | ||||||||||||||
| Cash and cash equivalents | USD thousands | 567,534.0 | 2,779,960.0 | 3,233,480.0 | 881,677.6 | (1,949,407.6) | (4,440,649.2) | (6,852,867.1) | (8,716,641.4) | (9,197,373.3) | (4,276,874.0) | 9,843,411.3 | 50,844,828.1 | 135,274,146.8 |
| Financial debt | USD thousands | 158,492.0 | 2,219,582.0 | 4,092,497.0 | 4,055,042.0 | 3,635,042.0 | 3,635,042.0 | 3,635,042.0 | 3,635,042.0 | 3,306,528.0 | 3,306,528.0 | 2,156,528.0 | 2,156,528.0 | (68,472.0) |
| Lease liabilities | USD thousands | 14,508.0 | 19,928.0 | 26,234.0 | 26,234.0 | 26,234.0 | 26,234.0 | 26,234.0 | 26,234.0 | 26,234.0 | 26,234.0 | 26,234.0 | 26,234.0 | 26,234.0 |
| Net debt (financial debt − cash) | USD thousands | (409,042.0) | (560,378.0) | 859,017.0 | 3,173,364.4 | 5,584,449.6 | 8,075,691.2 | 10,487,909.1 | 12,351,683.4 | 12,503,901.3 | 7,583,402.0 | (7,686,883.3) | (48,688,300.1) | (135,342,618.8) |
| Total equity | USD thousands | 669,146.0 | 2,392,325.0 | 2,162,591.0 | 1,607,756.1 | 1,046,495.6 | 667,525.9 | 948,008.7 | 2,959,638.1 | 9,013,112.4 | 24,654,756.6 | 60,719,975.8 | 142,150,592.4 | 315,157,444.5 |
| Balance check (assets − liabilities − equity) | USD thousands | - | - | - | - | - | - | - | - | - | - | - | - | - |
| Key ratios | ||||||||||||||
| EBITDA margin | % | (333.6%) | (334.2%) | (132.0%) | (35.2%) | 12.2% | 39.3% | 55.9% | 66.1% | 75.3% | 80.0% | 84.5% | 84.6% | |
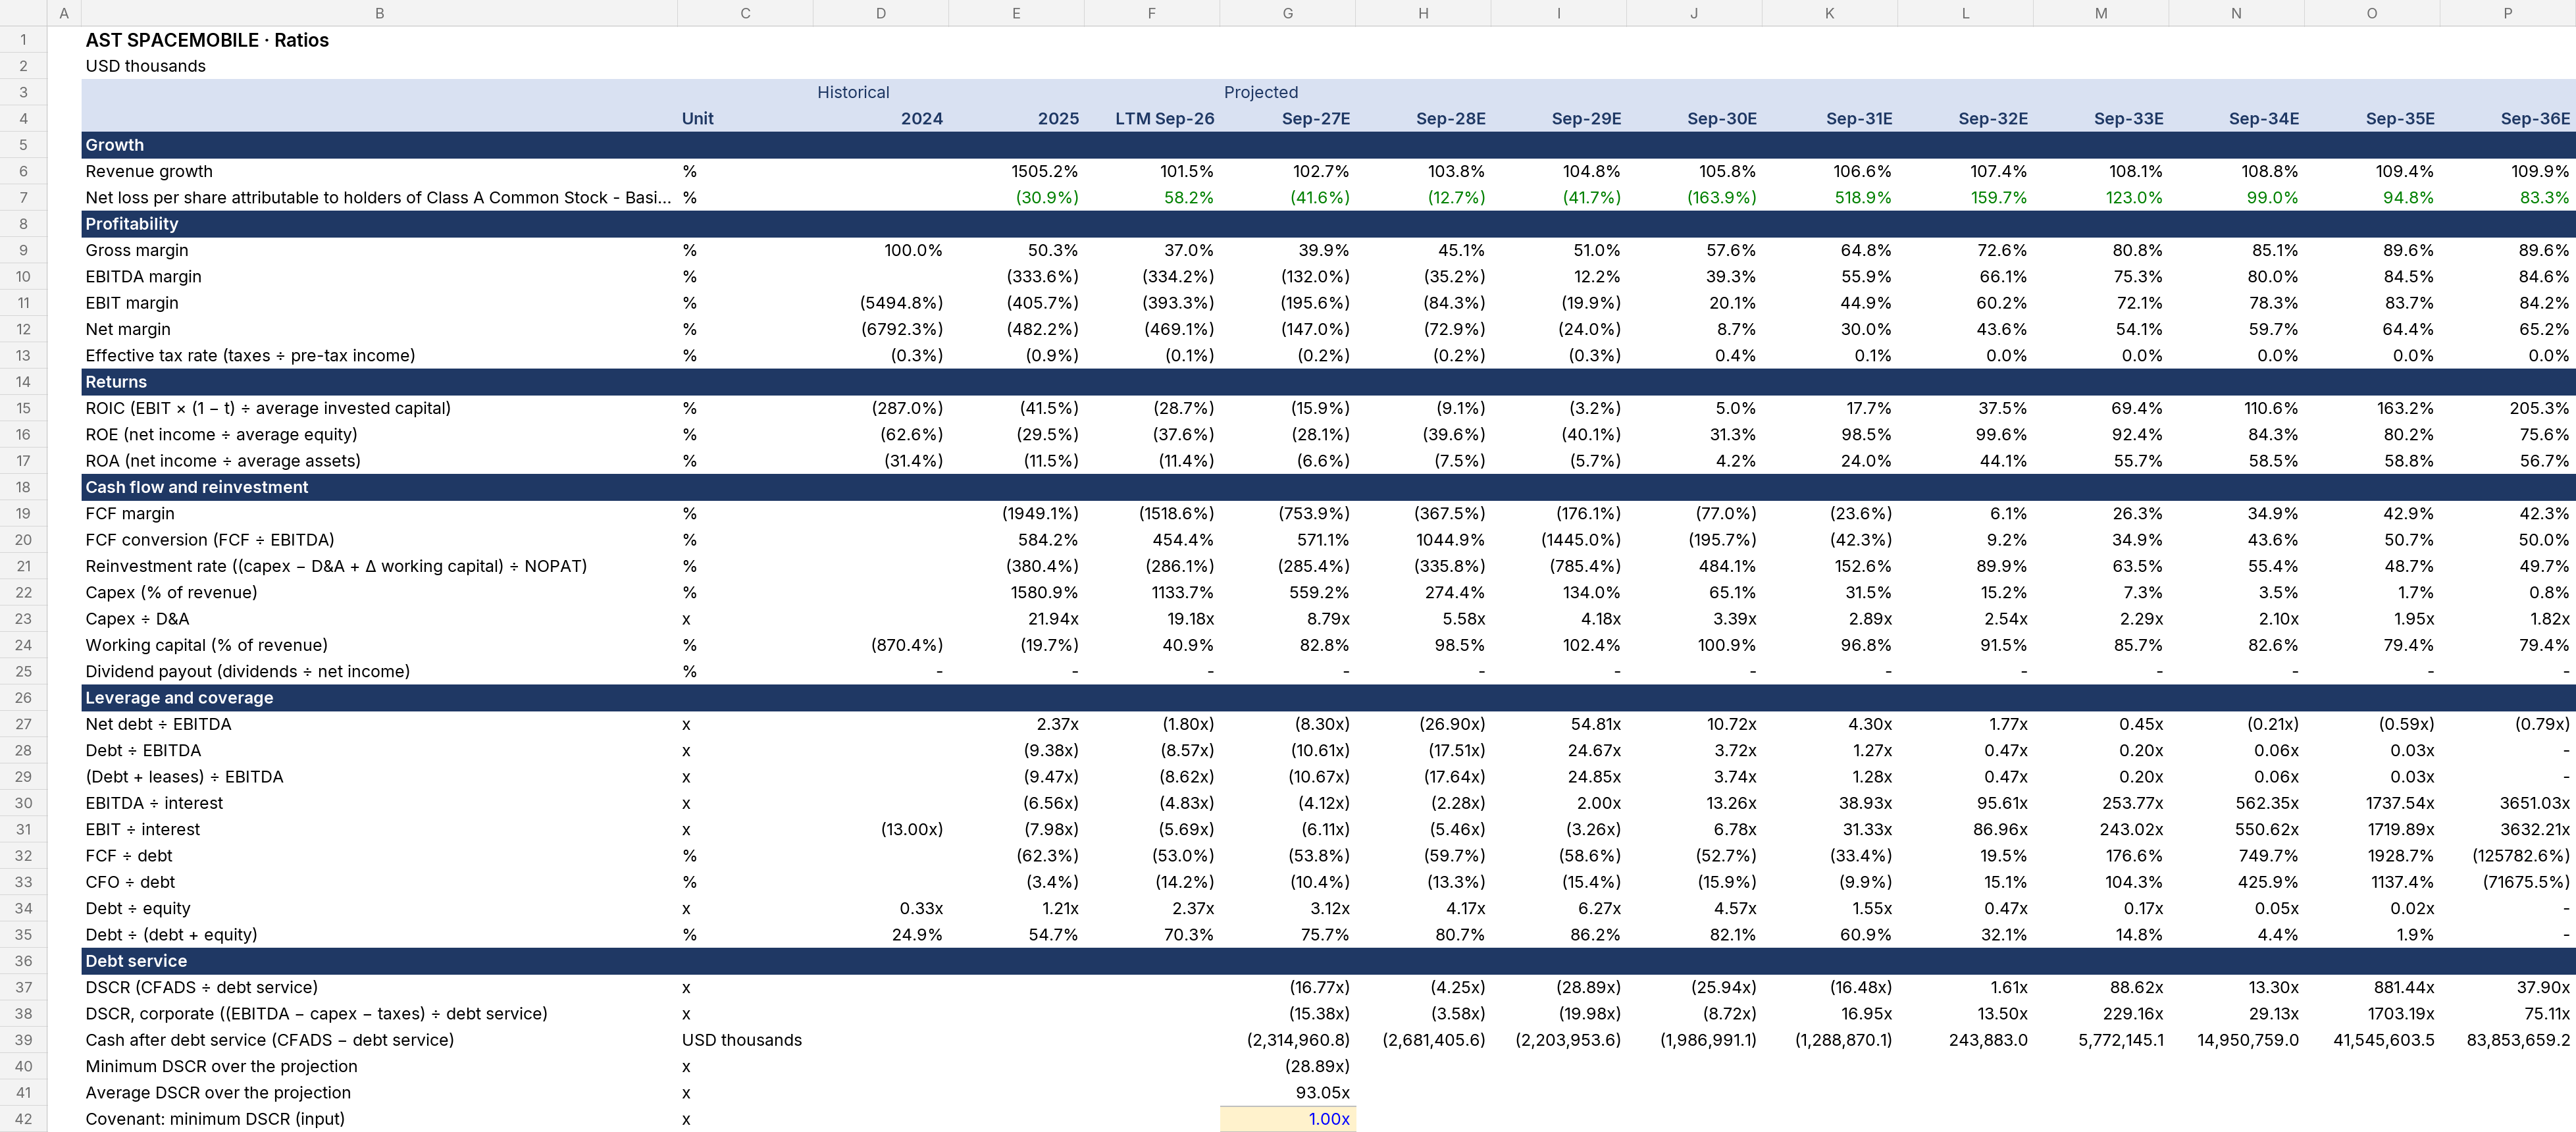
| ROIC (EBIT × (1 − t) ÷ average invested capital) | % | (287.0%) | (41.5%) | (28.7%) | (15.9%) | (9.1%) | (3.2%) | 5.0% | 17.7% | 37.5% | 69.4% | 110.6% | 163.2% | 205.3% |
| FCF margin | % | (1949.1%) | (1518.6%) | (753.9%) | (367.5%) | (176.1%) | (77.0%) | (23.6%) | 6.1% | 26.3% | 34.9% | 42.9% | 42.3% | |
| Net debt ÷ EBITDA | x | 2.37x | (1.80x) | (8.30x) | (26.90x) | 54.81x | 10.72x | 4.30x | 1.77x | 0.45x | (0.21x) | (0.59x) | (0.79x) | |
| EBITDA ÷ interest | x | (6.56x) | (4.83x) | (4.12x) | (2.28x) | 2.00x | 13.26x | 38.93x | 95.61x | 253.77x | 562.35x | 1737.54x | 3651.03x | |
| Minimum DSCR over the projection | x | (28.89x) | ||||||||||||
How revenue is built
Skale reads the documents to decide how each revenue stream is projected, and explains why.
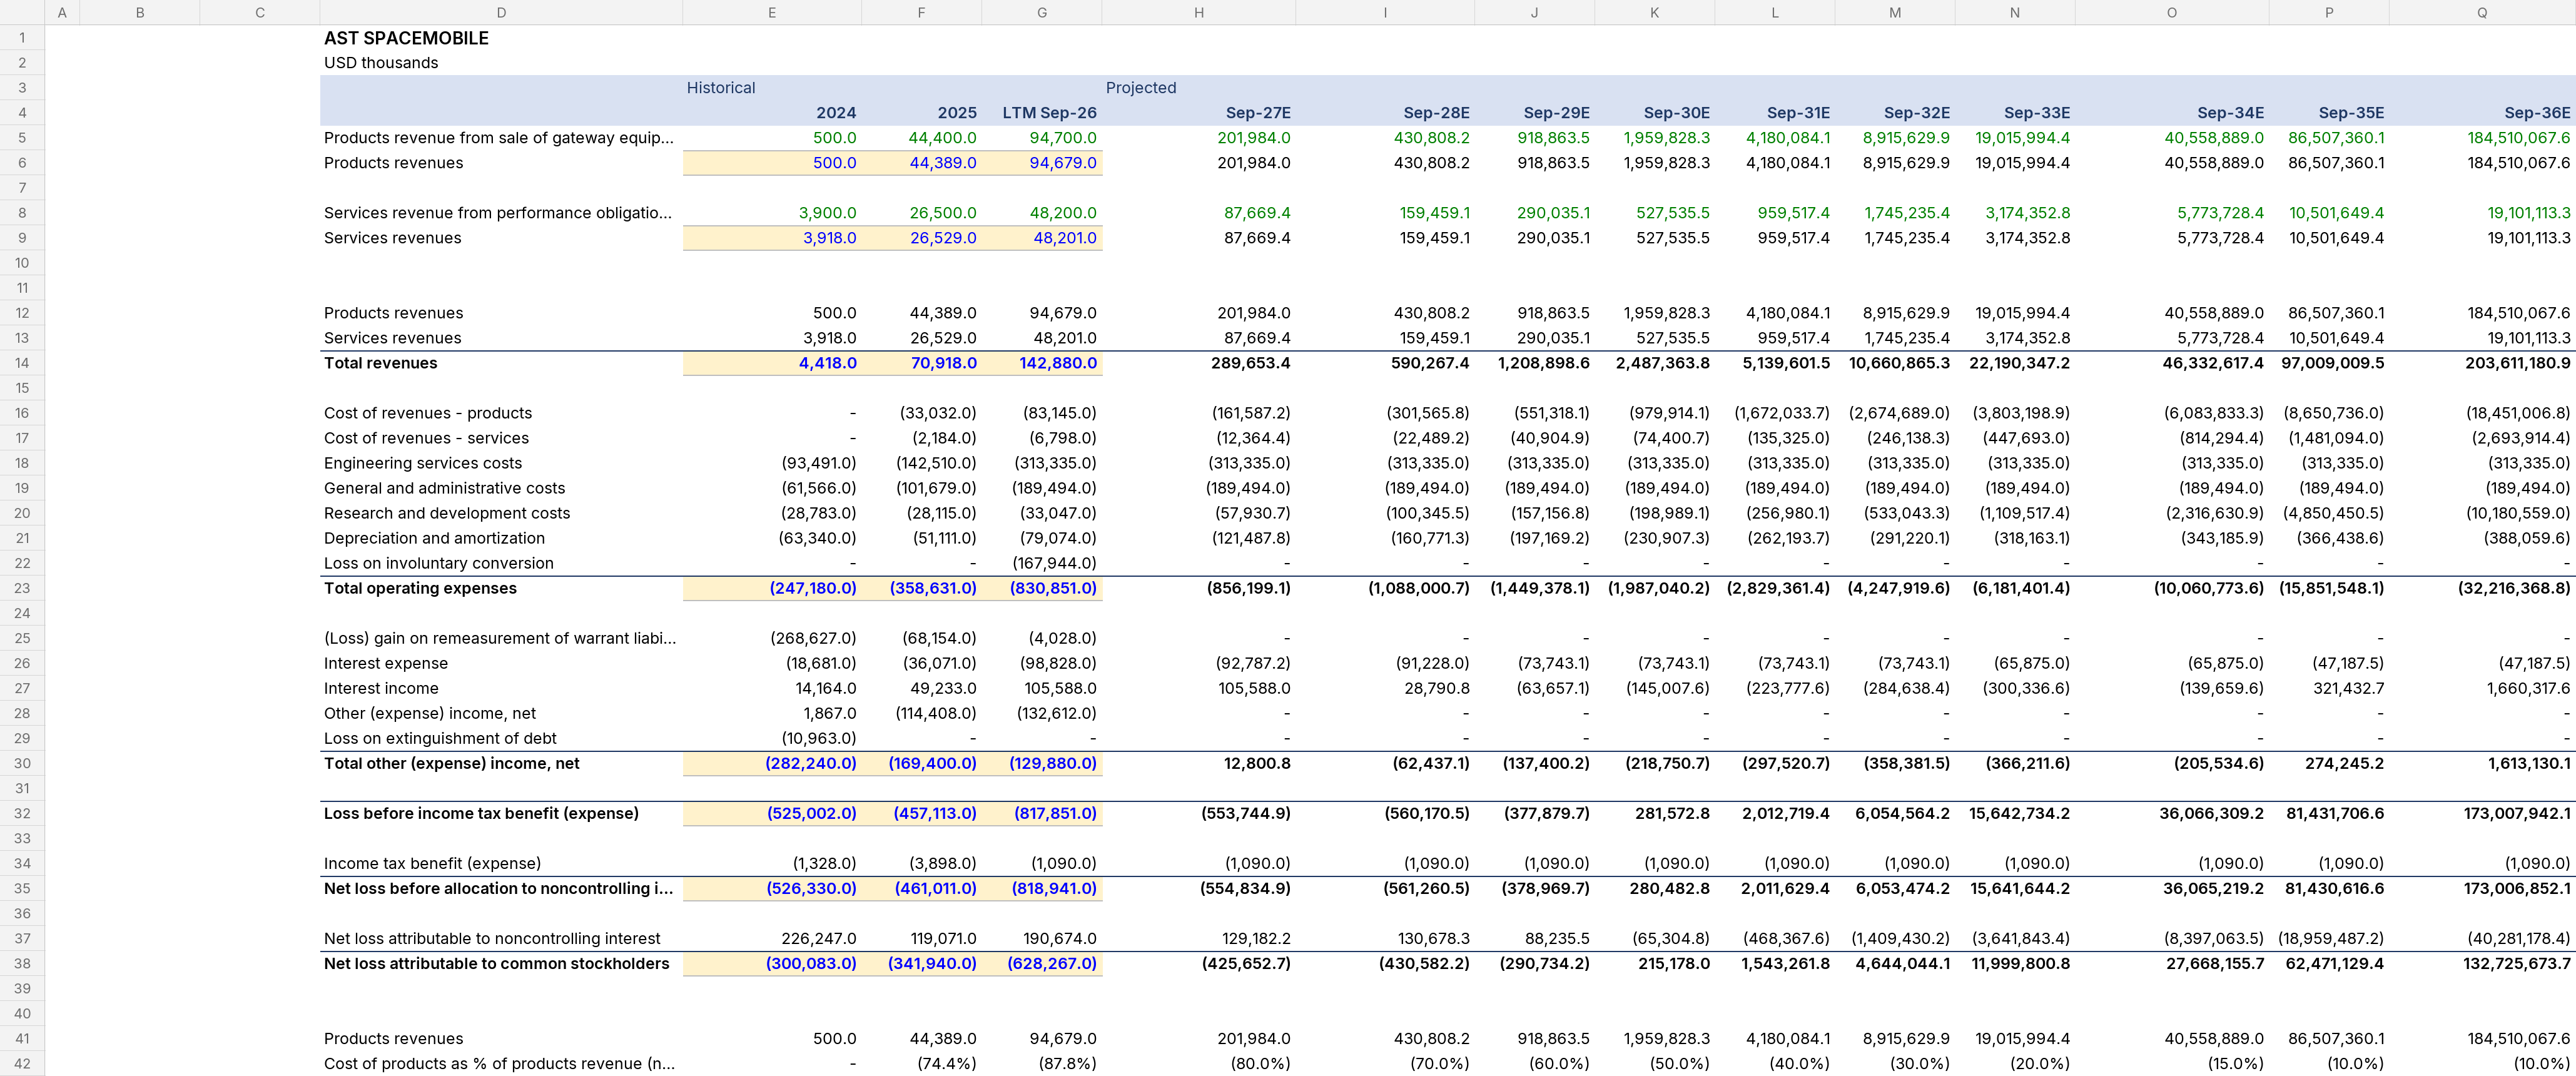
Gateway deliveries are reported for 2025 only, so volume × price is not supported. Growth on the last twelve months is kept, with a data request for the better build.
No driver is reported for two historical years at stream level. Remaining performance obligations are a company-wide total that mixes gateway, government and SpaceMobile Service obligations, so they do not measure this stream. Growth is kept, with a data request for a backlog build.
Build this for your company
Upload your financial statements; Skale builds the model, and you review the assumptions.
Get startedNew to financial models? What is a financial model?